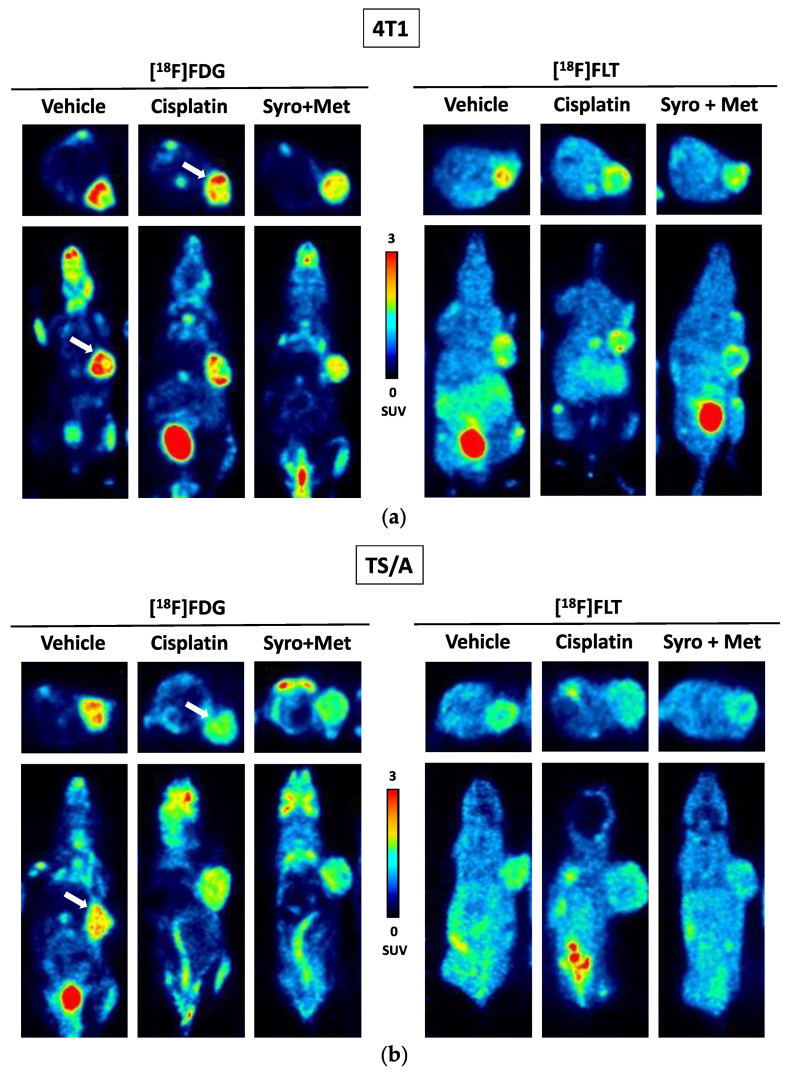
Figure 3.
Representative PET images, performed at 7 days post treatment, of a (a) 4T1 and (b) TS/A xenograft mouse per group (vehicle (ctrl); cisplatin and syrosingopine plus metformin) injected i.v. with either [18F]FDG (left) or [18F]FLT (right) radiotracer (~4.7 MBq/mouse). Images are reported as standardized uptake mean value (SUV mean). White arrows indicate 4T1 or TS/A tumor.

