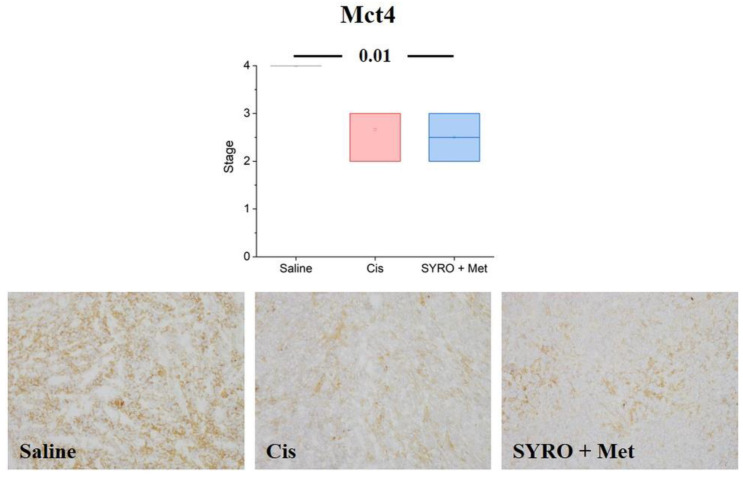
Figure 7.
Immunohistochemical expression of Mct4 was semi-quantitatively scored, and results were showed using Box and Whiskers plot. Below-sided, representative micrographs showing the different extent of MCT4 expression in tumor samples were obtained from xenotransplanted mice challenged with different treatments: saline (ctrl), cisplatin (cis), and Syro plus met. Statistical analysis: one-way Analysis of Variance (ANOVA) test. Original magnification: 10×.

