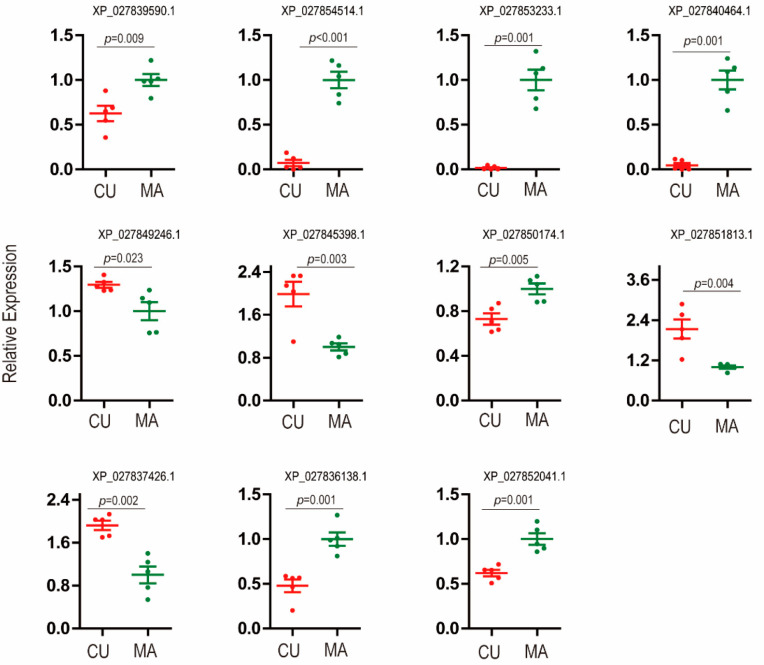
Figure 2.
Relative gene expression of 11 biotype-specific effector candidates that were identified by combined analysis of the proteomic and transcriptomic data. Red dots represent the CU biotype, and green dots represent the MA biotype. The vertical bar indicated standard error, and the p-value was the significance of the t-test (n = 5).

