Figure 1.
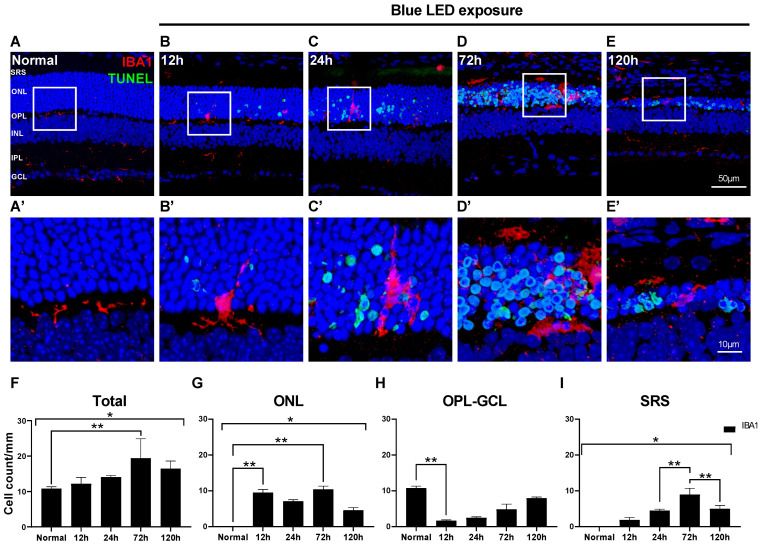
Distribution of microglial cells in blue LED-induced retinal degeneration (RD). Microglial cells and degenerating photoreceptors were labeled with anti-IBA1 antibody (red) and TUNEL (green). (A–E). Representative images of IBA1/TUNEL-double-labeled vertical sections taken from normal retina (A) and RD retinas at 12 (B), 24 (C), 72 (D), and 120 h (E). Each boxed area is magnified in (A’–E’), respectively. Scale bars: 50 μm (A–E), 10 μm (A’–E’). (F–I). Quantitative analyses of the IBA1-labeled microglial cells in RD. The number of the IBA1-labeled microglial cells was counted in the range of 700 μm from the optic disc in retinal vertical sections and presented as cell number per mm in each layer: whole retina (F), ONL (G), OPL to GCL (H), and SRS (I) (n = 5). Data are presented as the mean ± S.E.M. * p < 0.05, one-way ANOVA with Tukey’s multiple comparison post-hoc test, ** p < 0.05, Tukey’s multiple comparison test. GCL, ganglion cell layer; IPL, inner plexiform layer; INL, inner nuclear layer; OPL, outer plexiform layer; ONL, outer nuclear layer; SRS, subretinal space.

