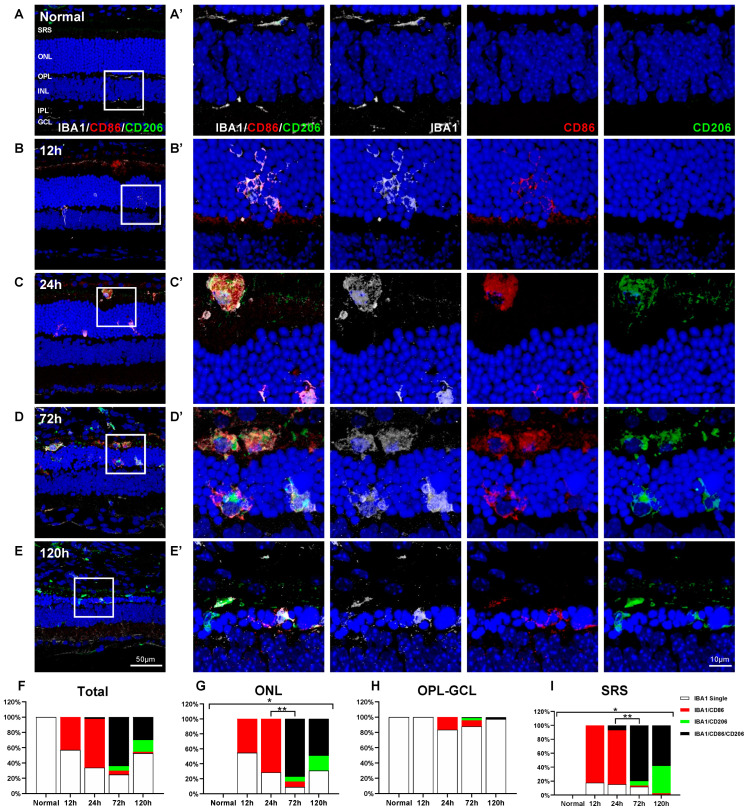
Figure 3.
Responses of the M1 and/or M2 microglial cells in blue LED-induced retinal degeneration (RD). Whole population of microglial cells, M1, and M2 cells were labeled with anti-IBA1 antibody (white), anti-CD86 antibody (red), and anti-CD206 antibody (green), respectively. (A–E). Representative images of IBA1/CD86/CD206-triple-labeled vertical sections taken from normal retina (A) and RD retinas at 12 (B), 24 (C), 72 (D), and 120 h (E). Each boxed area is magnified in (A’–E’), and the following three panels show IBA1-, CD86-, and CD206-channels, respectively. The first of them are a merging of three antibodies labeled images. Scale bars: 50 μm (A–E), 10 μm (A’–E’). (F–I). Quantitative analyses of the IBA1 single-labeled cells, IBA1/CD86-double-labeled cells, IBA1/CD206-double-labeled cells, and IBA1/CD86/CD206-triple-labeled cells in RD. Moreover, 100% stacked column chart shows their proportions. The cell number was counted in the range of 700 μm from the optic disc in retinal vertical sections and presented as cell number per mm by each layer: whole retina (F), ONL (G), OPL to GCL (H), and SRS (I) (n = 5). Data are presented as the mean ± S.E.M. * p < 0.05, one-way ANOVA with Tukey’s multiple comparison post-hoc test, ** p < 0.05, IBA1/CD86/CD206-triple-labeled cells number, Tukey’s multiple comparison test. GCL, ganglion cell layer; IPL, inner plexiform layer; INL, inner nuclear layer; OPL, outer plexiform layer; ONL, outer nuclear layer; SRS, subretinal space.

