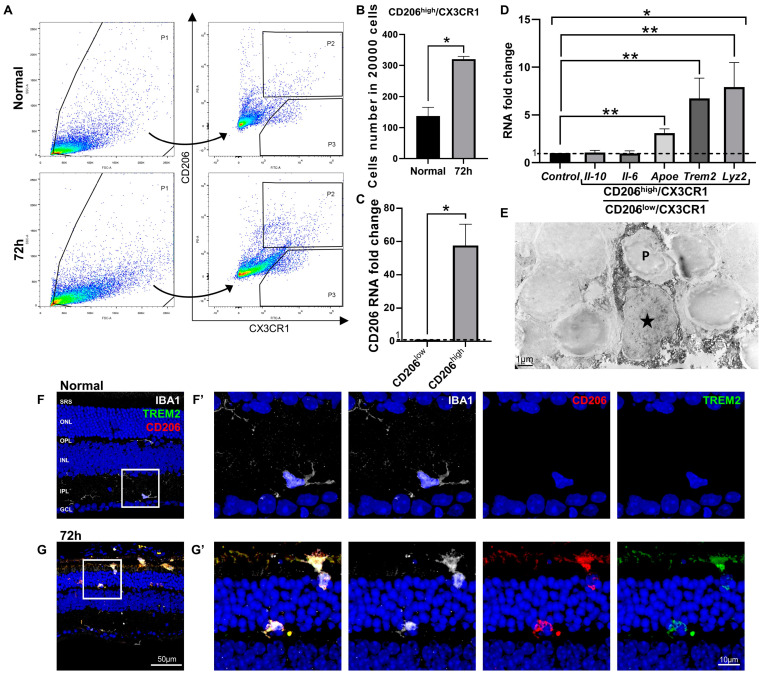
Figure 4.
Isolation and characterization of the CD206-labeled (IBA1/CD86/CD206-triple-labeled) microglial cells in blue LED-induced retinal degeneration (RD). (A). Microglial cells from the eyecups of the normal and RD 72 h retinas were sorted using FACS with anti-CX3CR1 antibody and anti-CD206 antibody. Cells were sorted into two groups, CD206high/CX3CR1 (P2) and CD206low/CX3CR1 (P3). (B). The number of the CD206high/CX3CR1 cells per 20,000 retinal cells in the normal and 72 h retina. (C). The RNA expression level of CD206 between CD206high/CX3CR1 and CD206low/CX3CR1 cells groups (n = 5, * p < 0.05, Student’s t-test). (D). The RNA expression level of the representative pro-inflammatory (Il-6), anti-inflammatory (Il-10), and phagocytosis-related (ApoE, Trem2, and Lyz2) genes between CD206high/CX3CR1 and CD206low/CX3CR1 microglial cells (n = 5, * p < 0.05, Student’s t-test). The fold-change of the RNA expression level was calculated using the delta-delta CT method after qRT-PCR. (E). Immuno-electron microscopy (EM) with anti-CD206 antibody taken from the outer nuclear layer (ONL) of the retina 72 h post-RD. A star (★) indicates cell body of a dark DAB-labeled microglial cell (MG), of which the cytoplasm is engulfing a dying photoreceptor (P). Scale bar: 1 μm. (F,G). Representative images of IBA1/CD206/TREM2-triple-labeled vertical sections taken from normal (F) and 72 h post-RD retinas (G). Each boxed area was magnified in (F’–G’). Scale bars: 50 μm (F,G), 10 μm (F’,G’). Data are presented as the mean ± S.E.M. * p < 0.05, one-way ANOVA with Tukey’s multiple comparison post-hoc test, ** p < 0.05, Tukey’s multiple comparison test. GCL, ganglion cell layer; IPL, inner plexiform layer; INL, inner nuclear layer; OPL, outer plexiform layer; ONL, outer nuclear layer; SRS, subretinal space; Il-10, interleukin 10 gene; Il-6, interleukin 6 gene.

