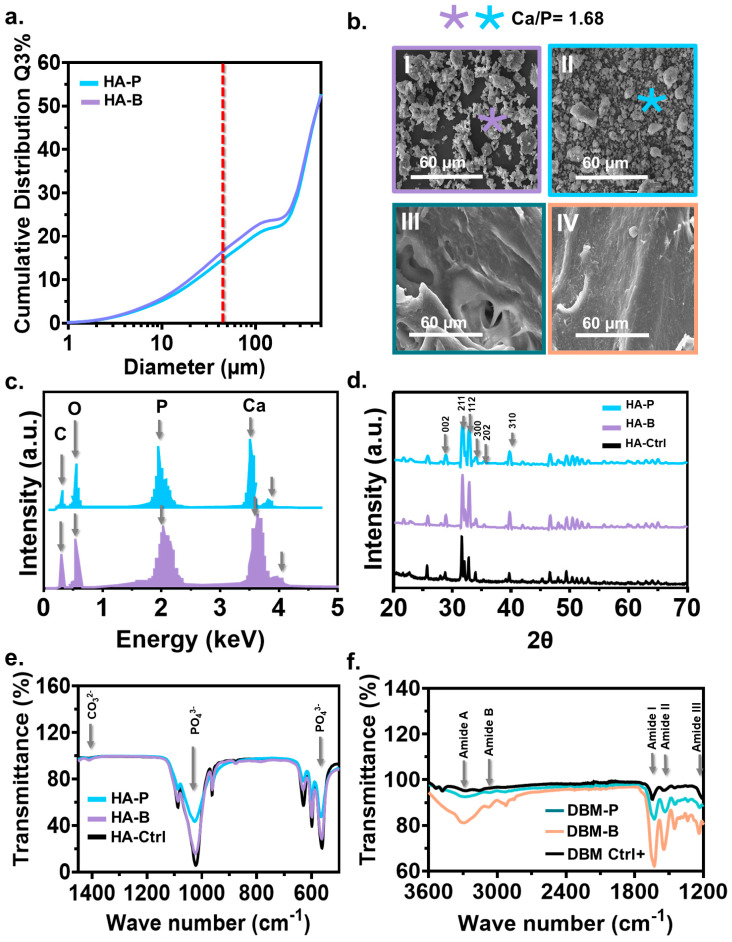
Figure 2.
The characterization of HA and DBM from bovine and porcine sources. (a) Particle size distribution of the HA extracted from porcine (P) and bovine (B) sources. Only particles smaller than 45 mm (red line) were considered for compound preparation. (b) Representative SEM micrograph of the extracted HA and DBM. (c) EDS analysis obtained from a randomly selected region (marked spot) of the extracted HA and DBM. (d) X-ray diffraction pattern of the extracted HA and their lattice planes. (e) Selected FTIR spectra of the extracted HA indicate the characteristic peaks corresponding to the vibrations of the phosphate (PO43−) groups. (f) The selected FTIR spectra of the extracted DBM indicate the characteristic bands associated with amide groups.

