Figure 3.
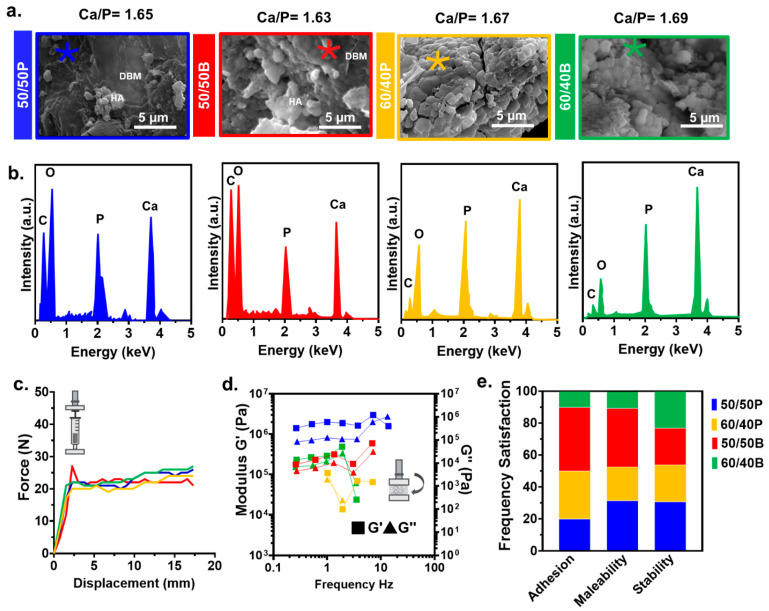
Characterization of the HA/DBM compounds. (a) Representative SEM micrographs of 50/50P (blue), 50/50B (red), 60/40P (yellow), and 60/40B (green) compounds. Regions in the SEM image where elements were analyzed are denoted by an asterisk (*). (b) The representative EDS spectrum of the HA/DBM compounds showed peaks corresponding to the materials present in the mixtures. (c) Injection force required for the compounds to be injected through a 27-gauge needle. All of the measurements were made, simulating a flow rate of 2 mL/h. (d) Frequency dependence of the storage modulus (G′) and loss modulus (G″) in HA/DBM compounds measured at 0.5% strain. (e) Clinical user preference according to their adhesion, malleability, and stability.

