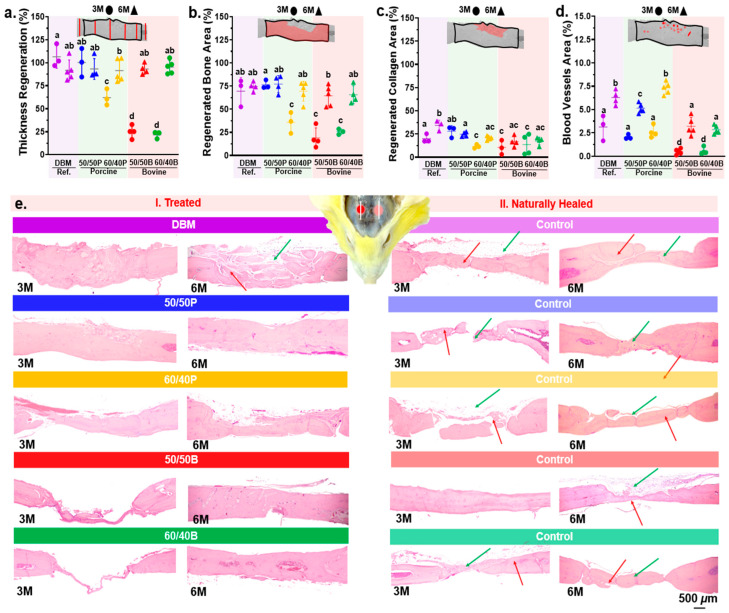
Figure 4.
Histological and histomorphometric analysis of the regenerated tissue in calvarial bone defects after the implantation of HA/DBM compounds. Results for 3 and 6 months after implantation are shown using circles and triangles, respectively. Colors represent each of the groups. (a) Percentage of calvarial thickness regeneration. (b) Percentage of regenerated bone. (c) Percentage of regenerated collagen. (d) Percentage of blood vessel area with respect to the total regenerated area. (e) Representative histological images of the treated defects (I. Left images) and naturally healed (II. Right images). Bone fragments and collagen tissue are indicated with red and green arrows, respectively. Means with different letters represent values that are significantly different from each other (p ≤ 0.05).

