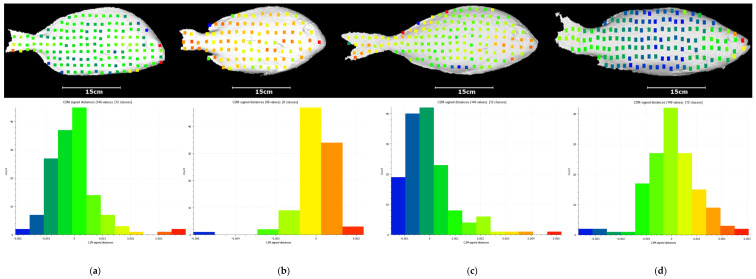
Figure 19.
The Ground Truth (GT) models of the fishes reconstructed in our paper: (a) white seabream, (b) red seabream, (c) gilthead seabream, (d) European seabass, and the corresponding signed distances histogram between the points resulting from our 3D reconstructions and their corresponding nearest points in the reconstructions derived from the GT data. The colored points on the GT models represent the points resulting from our 3D reconstructions. The colors of these points correspond to the colors of the signed distances shown in the histograms above.

