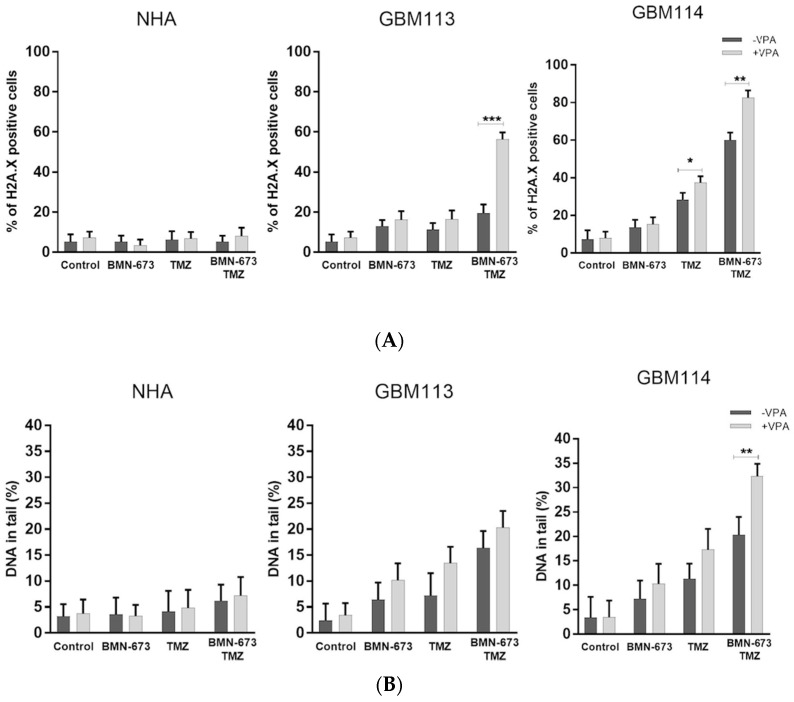
Figure 4.
Accumulation of DSB in VPA + BMN673 + TMZ-treated GMB113 and GBM114 glioblastoma cells. (A) DSBs were detected by γH2A.X immunofluorescence. Bars show mean percentage of γH2A.X—positive cells ± SD from 3 independent experiments. (B) DSBs were detected by neutral comet assay. Bars show mean percentage of DNA in tail ± SD from 50 randomly selected cells in 3 independent experiments. * p < 0.05 and ** p < 0.001, *** p-value ≤ 0.001 when compared to control group.

