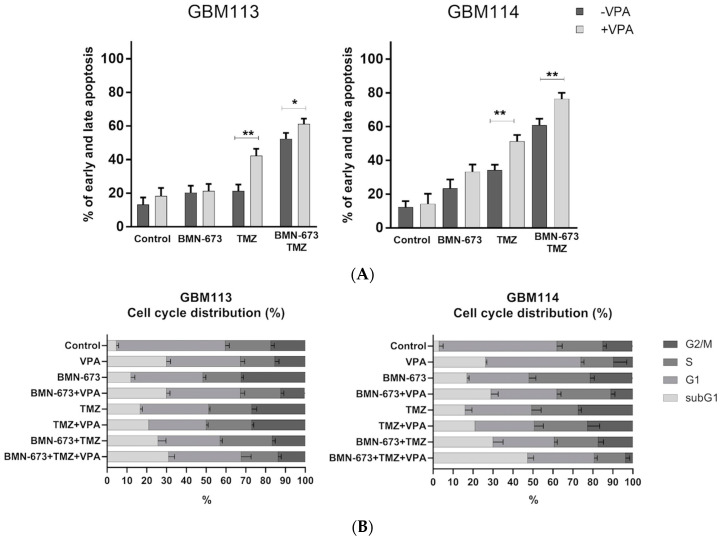
Figure 5.
Effects of valproic acid on the cell cycle and apoptosis (A). The percentage of GBM113 and GBM114 glioblastoma cells in early and late apoptosis (B). Cell cycle analysis was evaluated by FACS analysis after 48 h of treatments, following staining with PI. The bars represent the mean of the percentage of cells in each phase of cell cycle (subG1, G1, S and G2) plus S.D. of three experiments. At least three independent experiments were performed, and the results are shown as the mean ± standard deviation (SD). * p ≤ 0.05, ** p < 0.001, compared with the control group.

