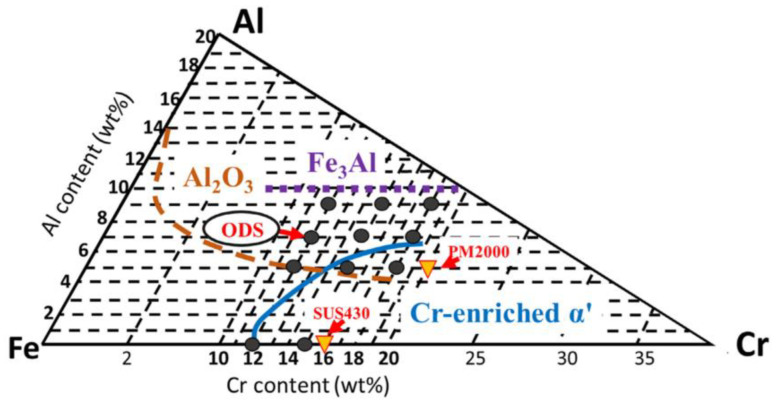
Figure 4.
Fe–Cr–Al ternary diagram: black spots and triangles represent the compositions of the ODS steels investigated in the presented work and the commercial steels, respectively. The Al2O3 formation zone at 1100 °C is bounded by a broken line. The zones of Fe3Al and Cr-enriched α phases at 475 °C are bounded by a dotted line and a solid line, respectively [49].

