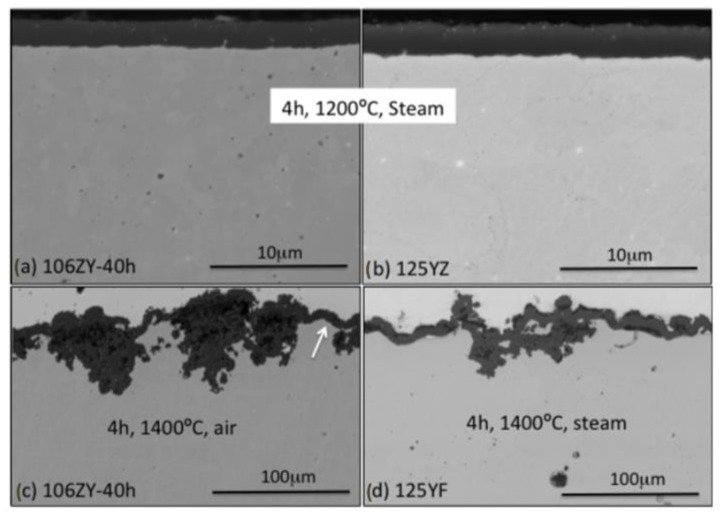
Figure 6.
BSE-SEM micrographs of the oxide scale formed (a) after 4 h at 1200 °C in steam, alloy 106ZY 40 h; (b) after 4 h at 1200 °C in steam, alloy 125YZ; (c) after 4 h at 1400 °C in air, alloy 106ZY 40 h; (d) after 4 h at 1400 °C in steam, alloy 125YF. The scale bars for (c,d) are ten times larger than the scale bars for (a,b). The white arrow highlights an area where the scale is locally protective [60].

