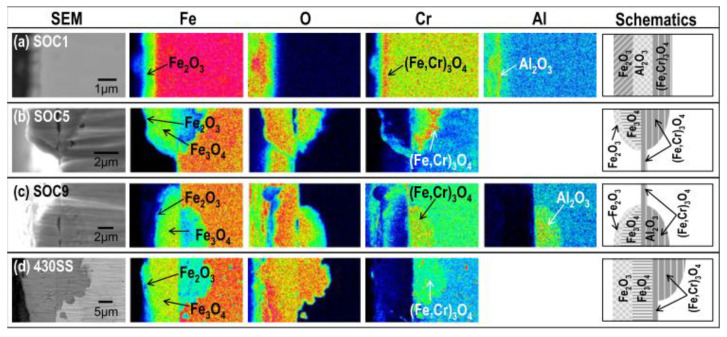
Figure 8.
SEM images showing the cross-sectional morphologies of (a) SOC-1 (Fe–16.11Cr–3.44Al–0.09Ti–0.34Y2O3), (b) SOC-5 (Fe–15.95Cr–0.09Ti–0.34Y2O3), (c) SOC-9 (Fe–15.42Cr–1.85W–3.8Al–0.10Ti–0.36Y2O3), and (d) type 430 SS (Fe–16Cr) and FE-EPMA analyses showing the corresponding composition distributions after exposure at 500 °C [64].

