Figure 3.
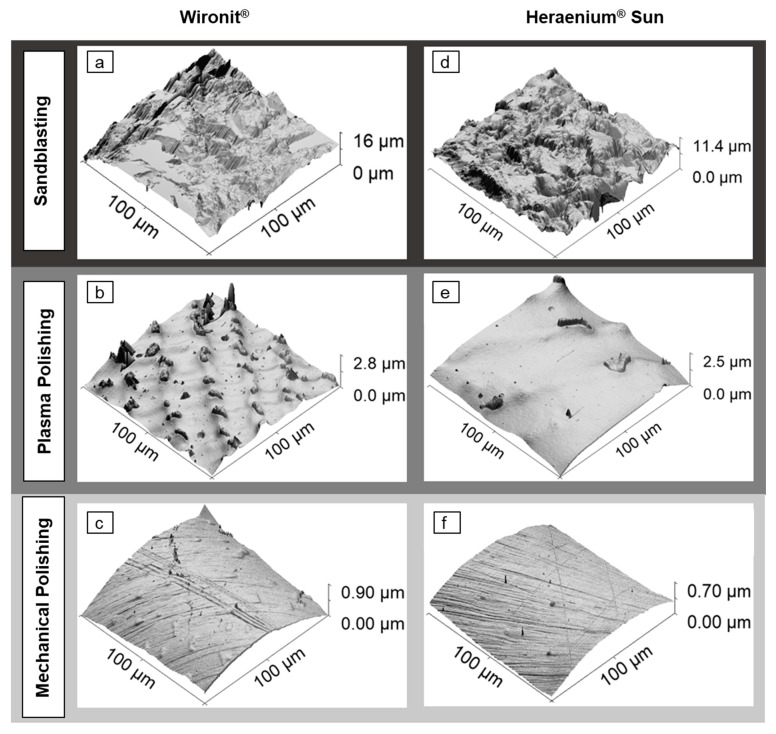
Comparison of 3D AFM images of sandblasted, mechanically polished and plasma electrolytically polished Co-Cr alloys. AFM images are 100 µm in width and height. They are shown with OpenGL lighting for better contrast. (a) Sandblasted Wironit® specimen showing a rough surface with irregular porosity. (b) Plasma-polished Wironit® specimen showing inhomogeneities and interspersed insular structures. (c) Mechanically polished Wironit® specimen showing a smooth surface with numerous polishing marks. (d) Sandblasted Heraenium® Sun specimen depicting a rough surface. (e) Plasma-polished Heraenium® Sun specimen showing a smooth surface with a few inhomogeneities and interspersed insular structures. (f) Mechanically polished Heraenium® Sun specimen showing a smooth surface with numerous polishing scratches.

