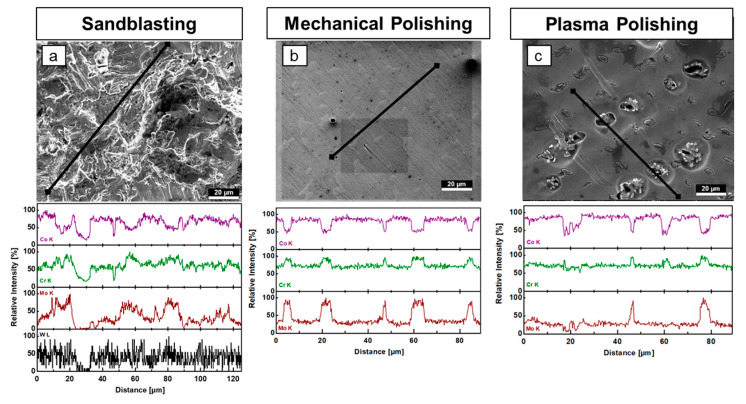
Figure 6.
Comparison of EDX measurements (a) Sandblasted Wironit® specimen analyzed with EDX along a defined line. Mo, Cr, Co and W were selected and are shown in corresponding concentration curves (1000-fold magnification; SEM and EDX). (b) A conventional laboratory-polished Wironit® specimen was analyzed with EDX along a defined line. Co, Cr and Mo were selected and shown in corresponding normalized concentration curves (1000-fold magnification; SEM and EDX). (c) Plasma electrolytically polished Wironit® specimen analyzed with EDX along a defined line. Co, Cr, Mo and W were selected and are found in corresponding normalized concentration curves. SEM image is shown at 1000-fold magnification.

