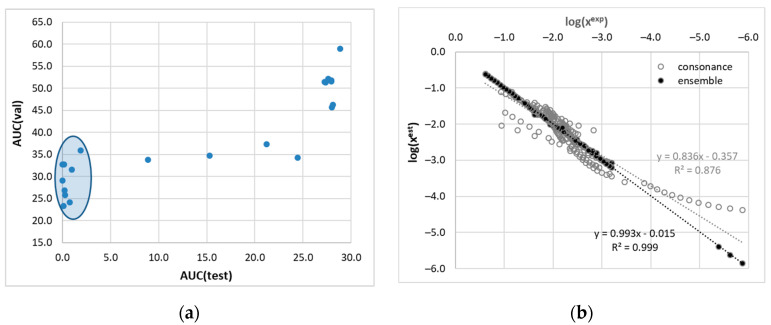
Figure 6.
Results of machine learning analysis of dapsone solubility in pure solvents and binary mixtures. (a) AUC (area under the curve) derived from the LCA using 5-fold cross-validation. (b) Correlation between calculated and measured solubility data. The black circles indicate the predictions of the ensemble, while the open circles document the results of consonance solvation using four reference solvents (MeAc, iBuOH, TETA, and Ace).

