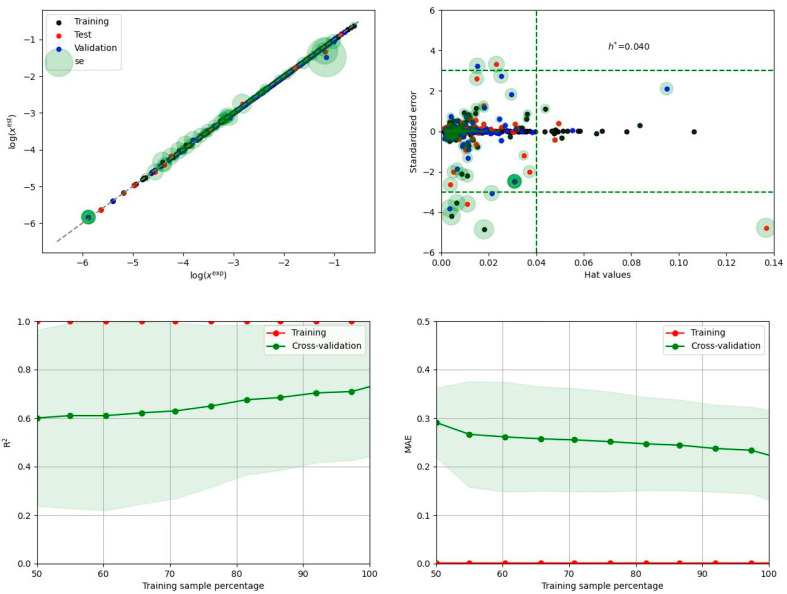
Figure 7.
Graphical representation of the performance of the NuSVR regressor, which was found to be best suited for dapsone solubility calculations based on molecular descriptors derived from solute–solvent intermolecular interactions. The top panel shows a correlation between calculated and measured solubility data and the applicability domain plot. Bottom panel illustrates the results of learning curve analysis (LCA) and area under the curve (AUC) determination.

