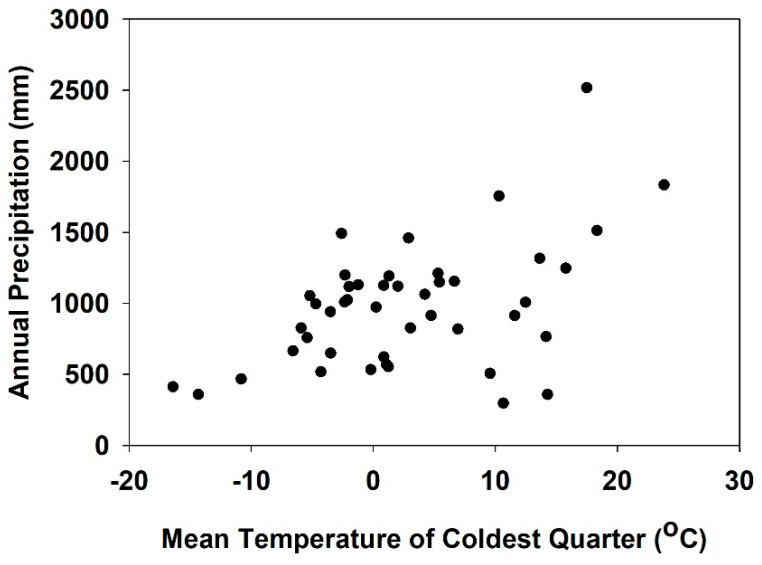
Figure 3.
Climate niche of the plant pathogen, S. sclerotiorum, based on annual precipitation vs. mean temperature of the coldest quarter. Black dots represent annual precipitation and mean temperature of coldest quarter from Worldclim weather data (https://www.worldclim.org, accessed on 12 December 2018).

