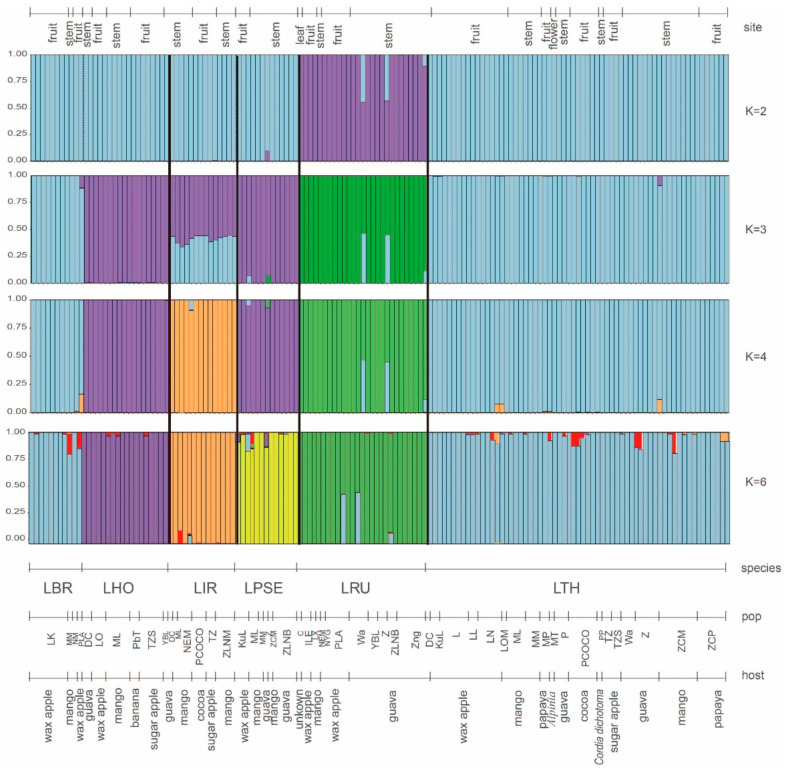
Figure 5.
Bar plots for the genetic structure of Lasiodiplodia species based on DNA sequence data generated by STRUCTURE. A vertical colour line represents each individual, the same colour indicates that the individual belongs to the same cluster, and black lines separate different species. [Species code] LTH: L. theobromae; LBR: L. brasiliensis; LHO: L. hormozganensis; LPSE: L. pseudotheobromae; LRU: L. rubropurpurea; LIR: L. iranensis. Refer to Table 1 for detailed information on population codes.

