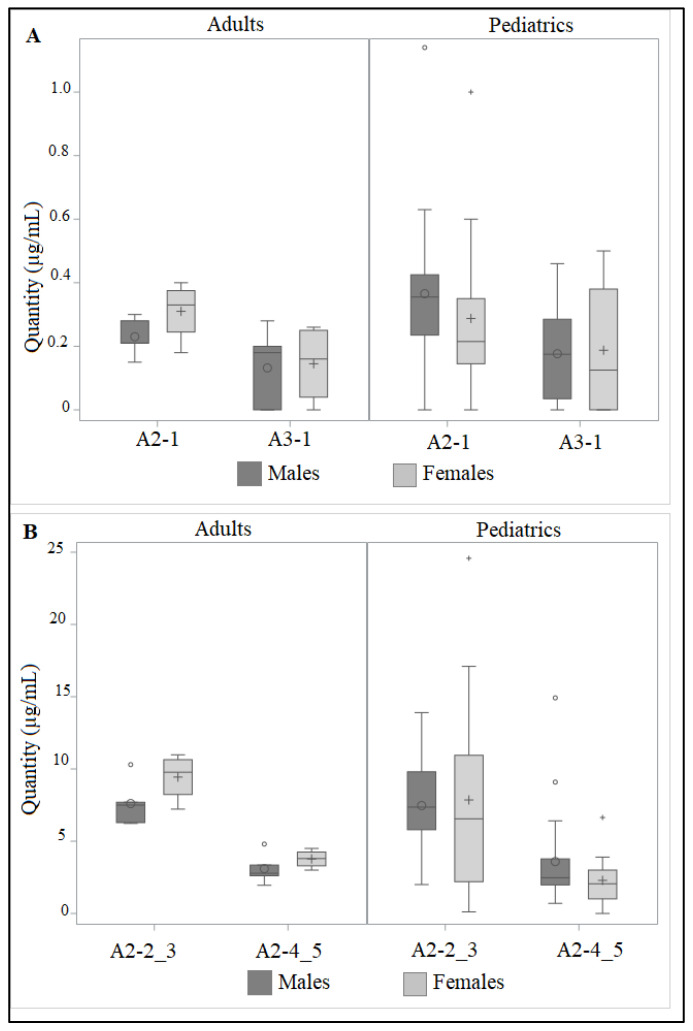
Figure 3.
Distribution of teicoplanin isoforms A3-1, A2-1, (panel (A)) A2-2_3 and A2-4_5 (panel (B)) in male (dark grey) and female (light grey) patients, considering pediatric and adult cohorts. Boxes and black lines in boxes represent, respectively, interquartile ranges (IQR) and median values; open dots represent mean values. Median values (horizontal line), IQR (bars), highest and lowest value (whiskers) are shown.

