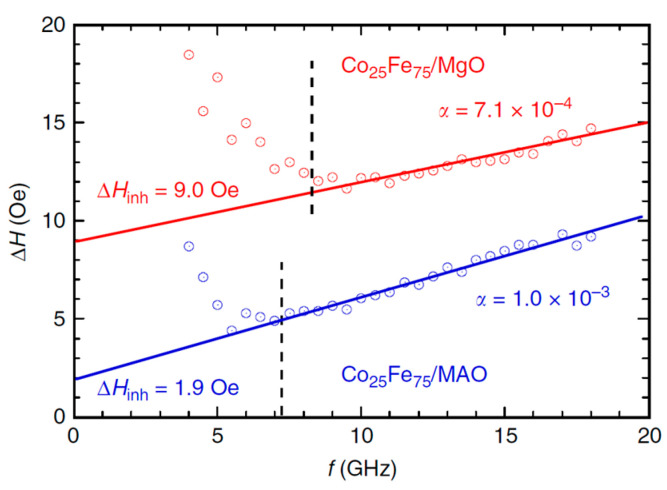
Figure 6.
Ferromagnetic resonance linewidths (Oe) vs. frequency (GHz) of Cr (2.8)/Co25Fe75(6.8)/MgO(001) in red and Cr(2.8)/Co25Fe75(6.8)/MgAl2O4(001) in blue. Solid lines represent linear fit for data points represented by circles. Dashed lines represent frequencies below which inhomogeneous broadening takes place due to incomplete saturation of the films [27]. Numbers in brackets are thicknesses in nm. Note that lower slope ΔH/f indicates lower damping.

