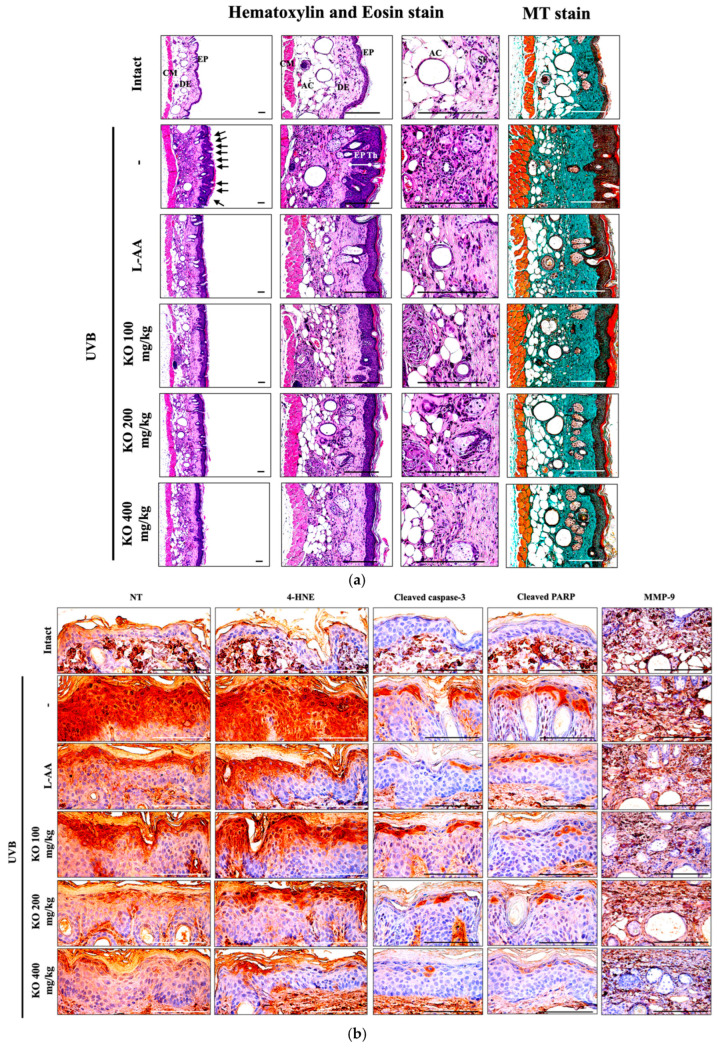
Figure 9.
(a) Representative images of stained skin with tissue with hematoxylin and eosin or Masson’s trichrome (MT). Arrows indicate microfolds in skin epithelial surface. Scale bars indicate 200 µm. (b) Immuno-stained skin tissue using nitrotyrosine (NT), 4-hydroxynonenal (4-HNE), cleaved caspase-3, cleaved PARP, and MMP9 antibodies. Scale bars indicate 100 µm. EP, epithelium; DE, dermis; CM, cutaneous muscle; SE, sebaceous gland; AC, adipocyte; Th, thickness.

