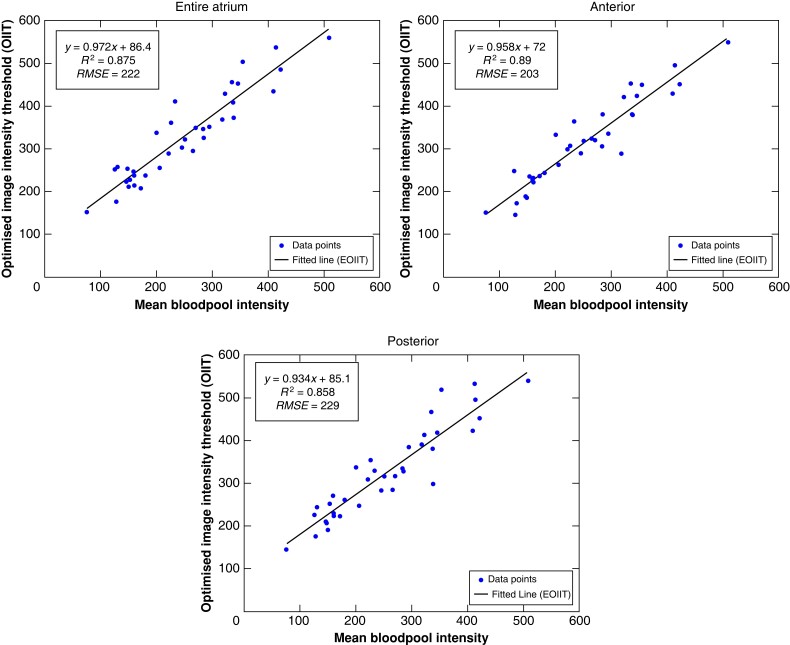
Figure 5.
Identification of the EOIIT using linear correlation between the individual patient’s mean blood pool intensity (x-axis) and optimal image intensity threshold (y-axis). From left to right, the results for the entire LA, anterior wall, and posterior wall are shown. Each dot represents one patient and theline is the best linear fit. EOIIT, estimated optimized image intensity threshold; OIIT, optimized image intensity threshold.

