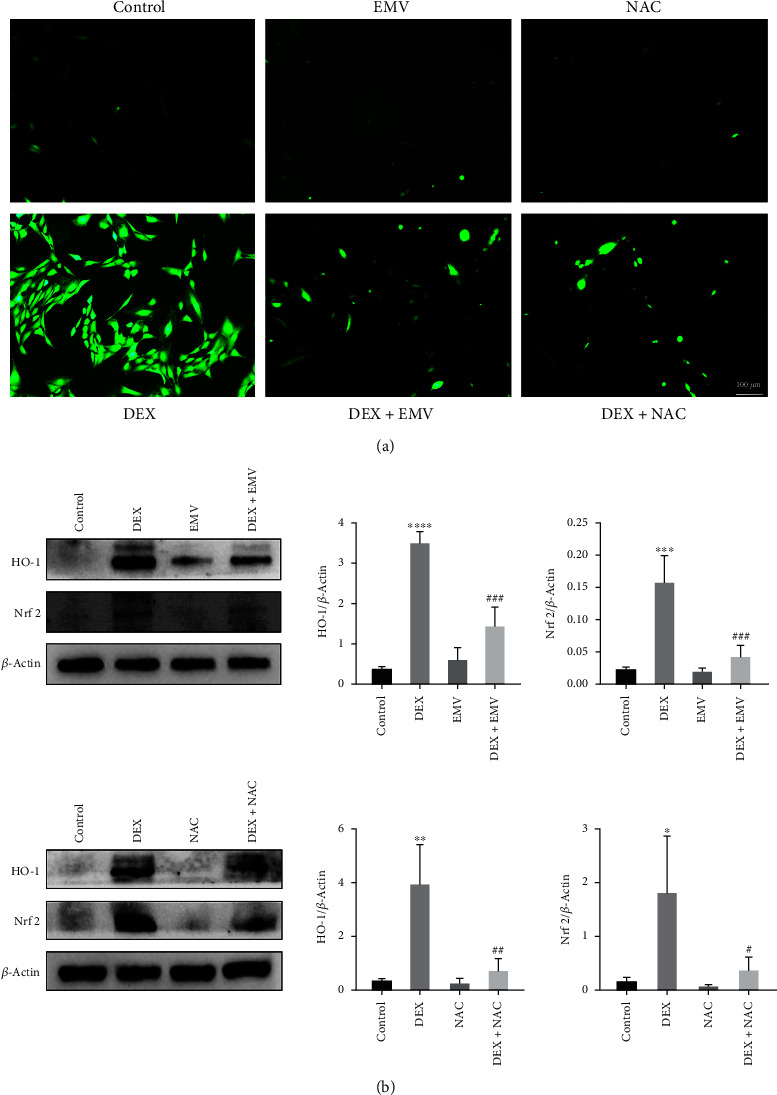
Figure 6.

Oxidative stress levels in MC3T3-E1 cells after hucMSC-EMVs and NAC intervention. (a) ROS generation level of MC3T3-E1 cells after hucMSC-EMVs and NAC intervention (scale bar: 100 μm). (b) HO-1 and Nrf 2 expression levels in MC3T3-E1 cells after hucMSC-EMVs and NAC intervention by western blot. ∗p < 0.05, ∗ ∗p < 0.01, ∗ ∗ ∗p < 0.001, and ∗ ∗ ∗ ∗p < 0.0001 compared wtih control group. #p < 0.05 and ##p < 0.01 compared to the DEX group.
