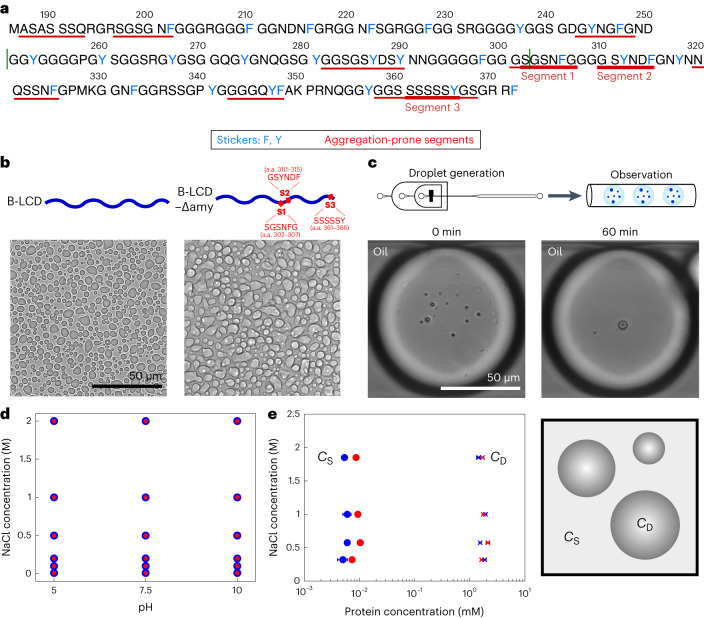
Fig. 1. LLPS of B-LCD and variant B-LCD–Δamy.
a, Sequence of the LCD of hnRNPA1-B (B-LCD). LCD of hnRNPA1-A (A-LCD) comprises amino acids (a.a.) 186–250 and 303–372 (borders indicated by green lines). Aromatic amino acids involved in LLPS are indicated in blue, while fibril-forming segments are underlined in red. b, Brightfield microscopy images of droplets formed by 30 µM B-LCD and 30 µM B-LCD–Δamy lacking three fibril-forming segments (ΔSGSNFG, ΔGSYNDF and ΔSSSSSY) in 50 mM Tris at pH 7.5 with 200 mM NaCl and 2 mM β-mercaptoethanol. Phase separation of B-LCD and B-LCD–Δamy was repeated independently at least three times with similar results. c, B-LCD droplets are liquid-like and merge in microfluidic water-in-oil droplet compartments until one single condensate is formed within 60 min. Microfluidic experiments have been repeated independently twice yielding similar results. d, Both 30 µM B-LCD (blue circles) and B-LCD–Δamy (red circles) undergo LLPS under a broad range of ionic strength and pH values. Circles indicate presence of LLPS. e, Protein concentrations inside (CD) and outside (CS) the droplets at different ionic strengths are similar for 30 µM B-LCD (blue) and B-LCD–Δamy (red). Error bars represent the standard deviation of the average protein concentration inside and outside the droplets, obtained by measuring three different droplets (for CD) using Raman spectroscopy and three independent samples (for CS) using centrifugation and UV absorbance (280 nm) at each NaCl concentration. When not visible, the error bars are smaller than the symbol.

