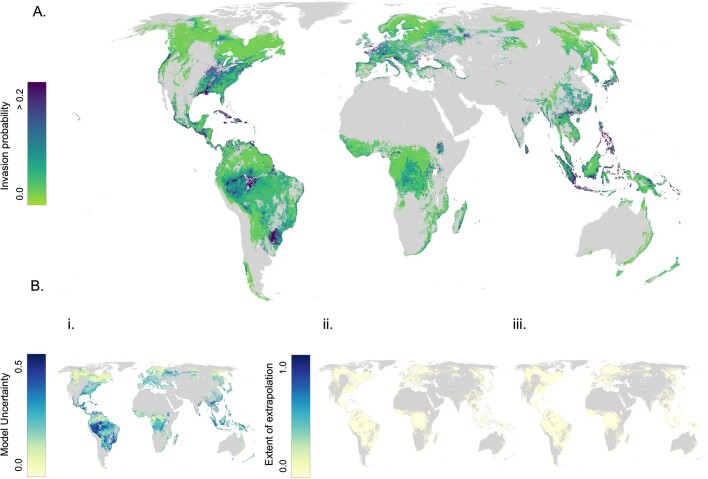
Extended Data Fig. 2. Map of non-native invasion probability inside the area of applicability.
Map showing probability of non-native tree presence based on the probability output of the random forest classifier (A, total n = 368,030 plots, n per iteration = 10,000 plots) alongside maps showing uncertainty in predictions (B) including local uncertainty of invasion probability via bootstrapped coefficient of variation (i) and extent of extrapolation as percentage of bands outside univariate (ii) and multivariate (ii) training range. Regions outside the Area of Applicability are masked.

