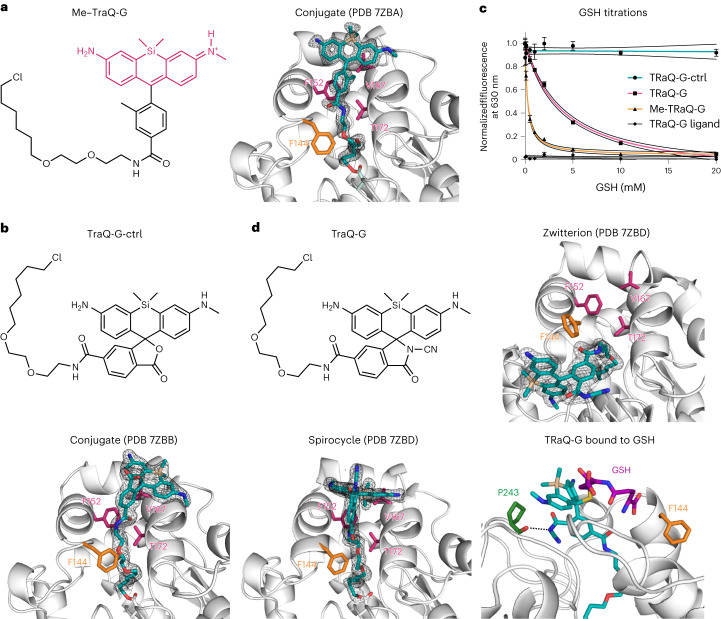
Fig. 2. Structures and reactivity of TRaQ-G probes.
a, Chemical structure of the small-molecule ligand for Me–TRaQ-G (left) and the X-ray crystal structure (right) of the ligand–protein conjugate (1.23 Å). b, Chemical structure of the small-molecule ligand for TRaQ-G-ctrl (top) and the X-ray crystal structure of the ligand–protein conjugate (1.95 Å) (bottom). c, GSH titrations of the three TRaQ-G probes and the TRaQ-G ligand (free small molecule). The concentration of the TRaQ-G probe was kept at 5–15 μM. N = 3 independently prepared samples were examined over three independent measurements. Data are presented as mean values, and error bars indicate the standard deviation. d, Chemical structure of the small-molecule ligand for TRaQ-G (top left), and the X-ray crystal structures of TraQ-G (1.69 Å), displaying the SiR ligand in the spirocyclic (bottom left) and zwitterionic (top right) forms, and a snapshot at 500 ns of the MD simulation of TRaQ-G with GSH bound (bottom right). Residues forming the hydrophobic pocket are displayed in pink, the Phe residue that moves between the open and closed conformations is displayed in orange, and the residue forming a hydrogen bond with the ligand is displayed in green. The 2Fo-Fc electron density map is displayed around the ligand with a standard deviation of all density values (σ) of 1.

