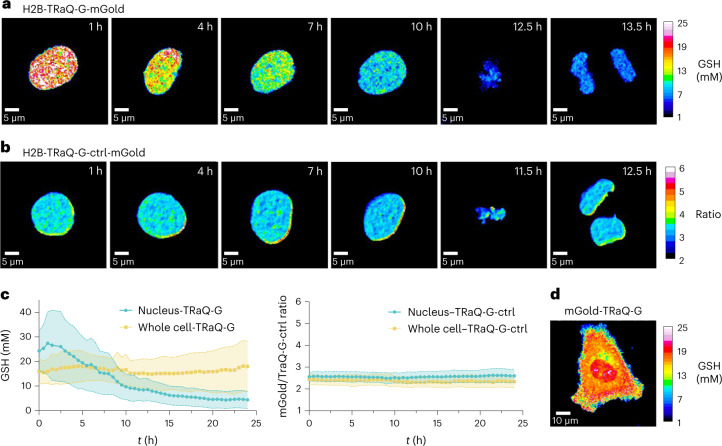
Fig. 4. Regulation of nuclear GSH concentrations during cell proliferation.
a, H2B–TRaQ-G–mGold ratiometric imaging of a single nucleus from S phase to mitosis, revealing a steady decrease in GSH concentration. b, The control probe TRaQ-G-ctrl–mGold confirms that the observed variations are a consequence of GSH fluctuations. c, Quantification of GSH concentrations or the variation of the ratio with the control probe for 24 h after release of cells from thymidine block (early S phase). Lines represent average values, and the shaded areas represent the standard deviation from N = 19, 50, 42 and 19 independent cells from three different passage numbers examined over three separate imaging sessions, for H2B–TRaQ-G–mGold, H2B–TRaQ-G-ctrl–mGold, TRaQ-G–mGold and TRaQ-G-ctrl–mGold, respectively. d, TRaQ-G–mGold ratiometric imaging of a single cell (t = 2 h) displaying different concentrations in the nucleus and the rest of the cell.

