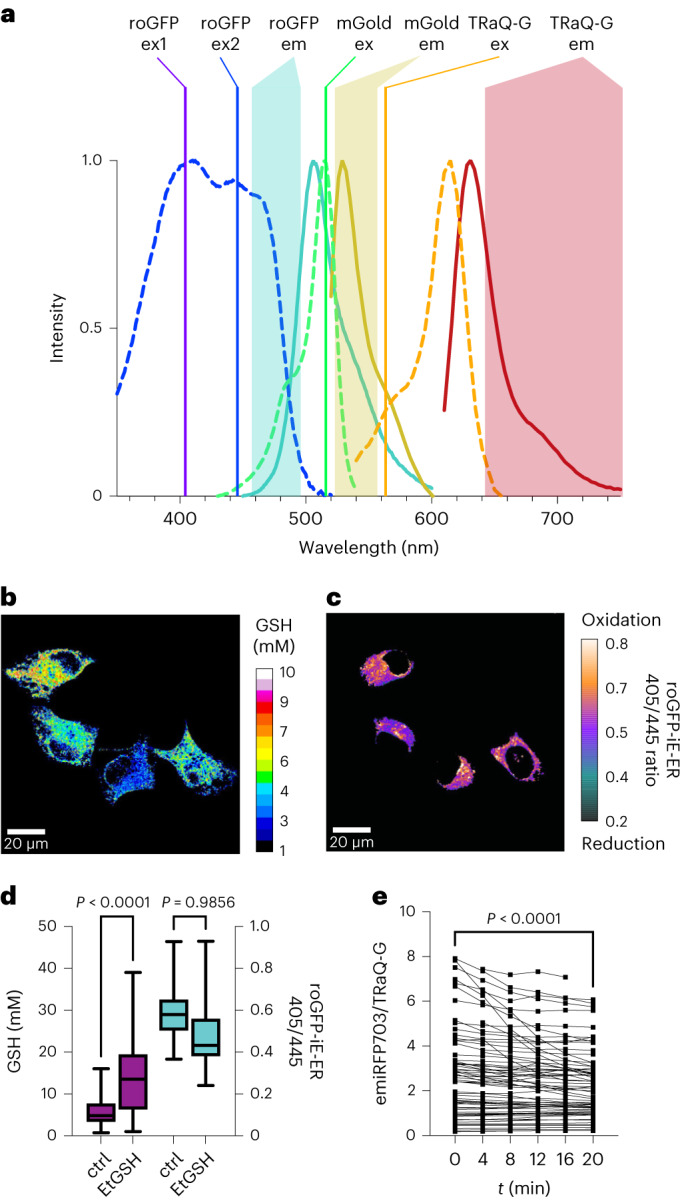
Fig. 5. Multicolour and NIR imaging with TRaQ-G.

a, Schematic representation of a four-colour experiment multiplexing roGFP-iE-ER and calnexin–TRaQ-G–mGold. Coloured lines represent the excitation wavelengths of the chromophores. Absorption (dashed lines) and emission spectra (solid lines) of the different fluorophores are displayed in corresponding colours, and shaded areas indicate the emission filters used to collect photons at different wavelengths. b,c, Ratiometric imaging of total GSH concentration using calnexin–TRaQ-G–mGold (b) and of redox potential (c) using roGFP-iE-ER. The image in c is not calibrated, and only the ratio of emission at 475 nm upon excitation at either 405 or 445 nm is displayed. d, Comparison of GSH concentrations and 405/445 ratios of roGFP-iE-ER in cells either untreated (ctrl) or after incubation with 10 mM EtGSH for 3 h. Statistical significance was evaluated by one-way ANOVA (Šídák’s multiple comparisons test), for N = 119, 115, 86, 103 (from left to right) independent cells from three different passage numbers examined over three separate imaging sessions. e, Qualitative monitoring of the decrease in GSH concentration using the NIR sensor H2B–TRaQ-G-emiRFP703 (uncalibrated) in cells treated with 1 mM H2O2 during a period of 20 min. N = 67 independent cells per time point from three different passage numbers were examined over three separate imaging sessions. Statistical significance was evaluated by paired t-test. In d, boxes represent 25th to 75th percentiles, the centre line represents the median, and whiskers extend from minimum to maximum. In e, individual cell values are depicted.
