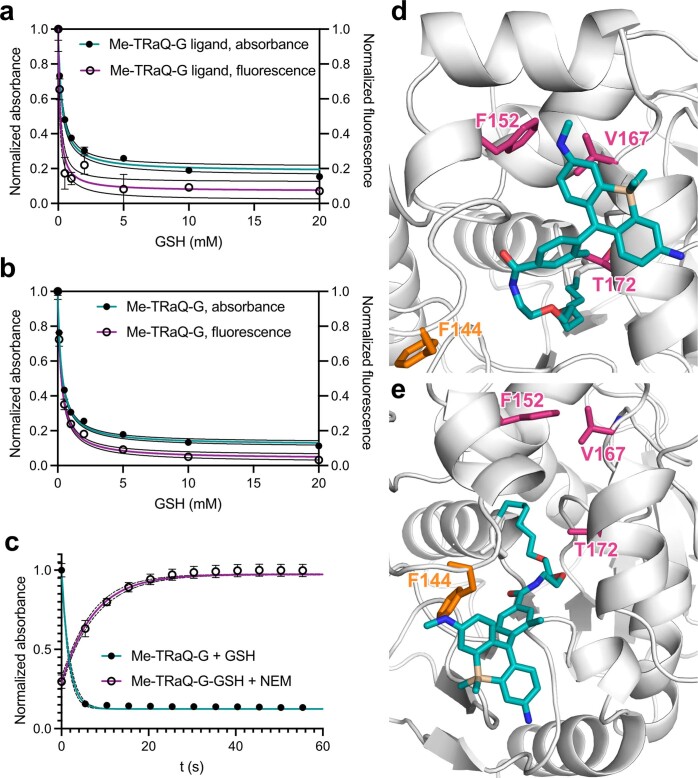
Extended Data Fig. 1. GSH titrations and MD results.
a) Me–TRaQ-G shows good GSH-sensitivity in the range of 0–5 mM by itself and b) as HT adduct. c) The conjugate with GSH forms rapidly in vitro and is reversible by adding the GSH scavenger NEM. N = 3 independently prepared samples examined over 3 independent measurements. Data are presented as mean values and error bars indicate the standard deviation. Data were fitted by one-phase decay, dotted lines represent 95% confidence interval (CI). d) Preferred conformation of Me–TRaQ-G during MD simulation (322 ns) with methyl group pointing into hydrophobic pocket. e) Short-lived conformation of Me–TRaQ-G during MD simulation (457 ns) with methyl group exposed to the solvent. Residues forming the hydrophobic pocket are displayed in pink, the Phe residue that moves between the open and closed conformation is displayed in orange.

