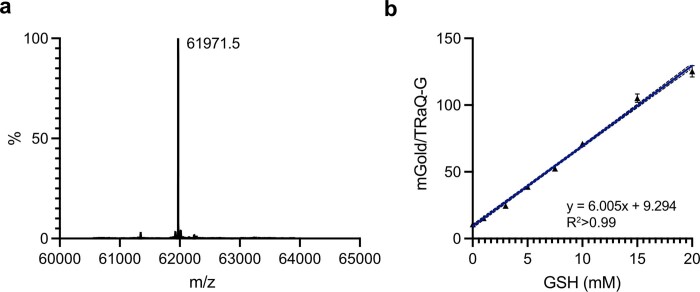
Extended Data Fig. 3. In vitro characterization and calibration of TraQ-G.
a) Deconvoluted mass spectrum of TRaQ-G reacted with HT in vitro. b) Calibration curve of TRaQ-G with adduct formed by in vitro reaction of purified fusion protein with ligand and measured by fluorescence microscopy. N = 3 independently prepared samples examined over 3 independent measurements. Data are presented as mean values and error bars indicate the standard deviation. Data were fitted by linear regression. Dashed line represents 95% CI.

