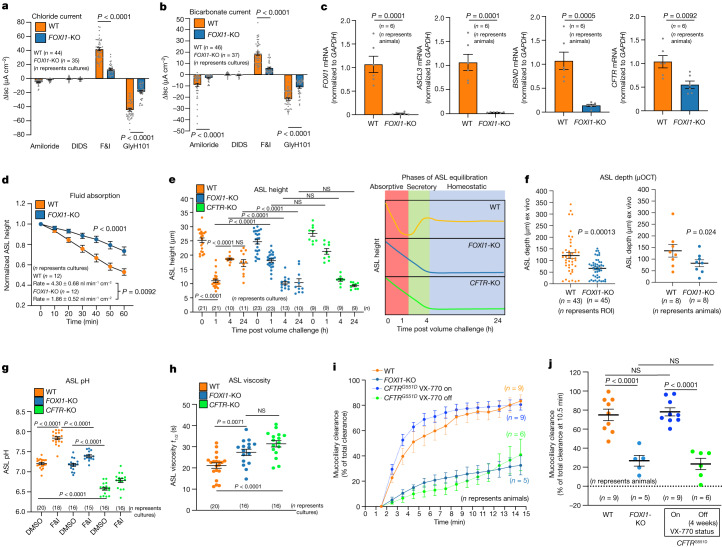
Fig. 1. Depletion of pulmonary ionocytes impairs CFTR-mediated regulation of ASL volume, pH, viscosity and MCC.
a,b, Change in short circuit current (ΔIsc) for Cl− (a) and HCO3− (b) from ferret ALI cultures of the indicated genotypes. F&I, forskolin and IBMX; WT, wild type. c, RT–qPCR for ionocyte-enriched transcripts in ferret ALI cultures. d, Fluid absorption showing the ASL height normalized to time zero following small volume addition to the apical surface. Fluid absorption rates are marked on the graph. e, Changes in ASL height over time following small volume challenge (at 0 h) to ALI cultures. Right schematic depicts absorptive and secretory phases of ASL equilibration that are altered in FOXI1-KO and CFTR-KO cultures. f, μOCT imaging of ferret tracheal ASL depth. ASL depths were compared by region of interest (ROI) and animal averages. g, Alkalinization of ASL pH in ALI cultures following CFTR stimulation with forskolin/IBMX. h, ASL viscosity in ALI cultures. i, In vivo ferret tracheal MCC measured by PET/CT for the indicated genotypes and CFTR modulator (VX-770) treatment status. j, Percentage tracheal clearance at 10.5 min following instillation of radioactive tracer for ferrets evaluated in h. Data are mean ± s.e.m. for the n indicated in each graph (ALI cultures or animals). Statistical significance was determined by: one-way analysis of variance (ANOVA) and Sidak’s multiple comparisons test (a–c); two-way ANOVA for graphed genotypic differences and two-tailed Student’s t-test for rates (d); one-way ANOVA and Tukey’s multiple comparison test (e,g,h,j); ROI by t-tests with pooled s.d. by R and animal averages by paired one-tailed Student’s t-test (f). The numbers of independent ferrets used for each experiment were: 12 WT, 9 FOXI1-KO (a); 10 WT, 8 FOXI1-KO (b); 6 in each group (c,d); 9 WT, 10 FOXI1-KO, 3 CFTR-KO (e); 8 in each group (f); 6 WT, 5 FOXI1-KO, 4 CFTR-KO (g); 6 WT, 4 FOXI1-KO, 3 CFTR-KO (h); 9 WT, 5 FOXI1-KO, 9 CFTR (i, j). DIDS, 4,4′-diisothiocyanato-stilbene-2,2′-disulfonic acid; NS, not significant; RT–qPCR, quantitative PCR with reverse transcription.

