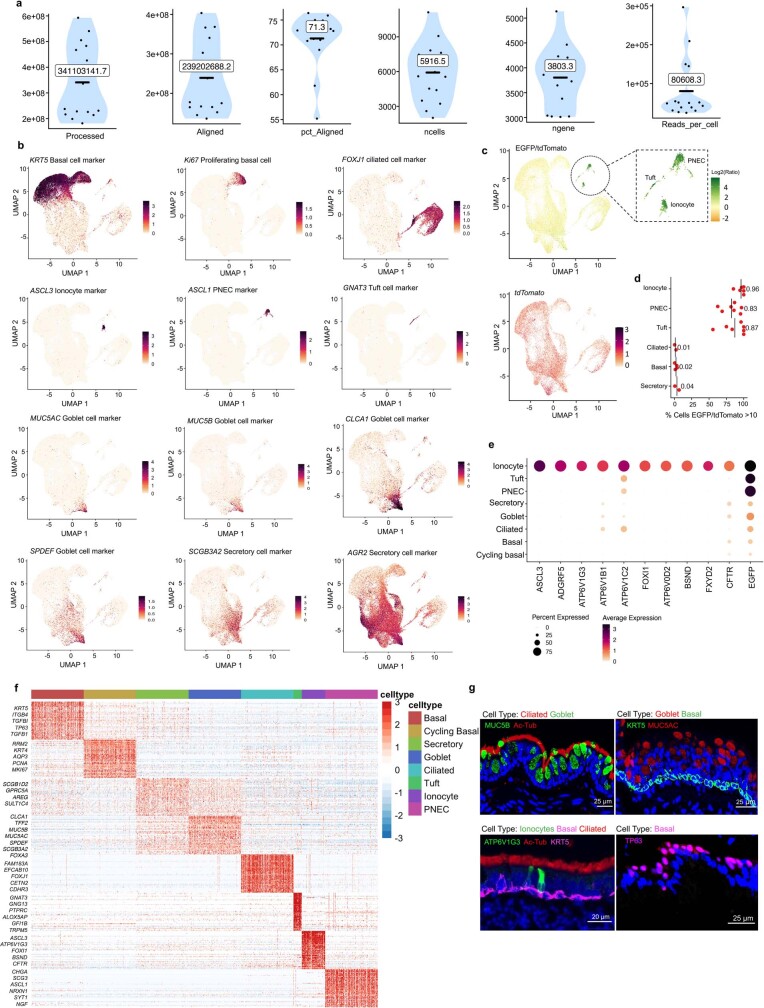
Extended Data Fig. 4. Single-cell expression atlas of ferret proximal airway epithelial cells.
a, Quality metrics for droplet-based 3′ scRNA-seq data. b, Cluster annotation by the expression of known cell type markers. UMAP visualization of 77,099 single cells where individual points correspond to single cells. c, UMAP visualization of EGFP/tdTomato (ratio) and tdTomato expression for all cells sequenced. Note, FOXI1-CreERT2::ROSA-TG ALI cultures used for ionocyte enrichment were treated with OH-Tam throughout basal cell differentiation at ALI. This leads to lineage labeling (EGFP expression) and enrichment by FACS of all rare cell types (ionocytes, tuft, and PNECs). Thus, FOXI1 is expressed in common early precursor of these rare cell types. d, Percentage of cells with a ratio of EGFP/tdTomato greater than 10. e, Ferret pulmonary ionocyte markers. Expression level of ionocyte marker genes (columns) in each airway epithelial cell type (rows). Note that EGFP+ FOXI1-lineage labeled tuft and PNECs extinguish FOXI1 and other ionocyte markers when fully differentiated. f, Ferret airway epithelial cell gene expression signatures. The relative expression of genes (rows) across cell types (columns) is shown, sorted by cell types. g, Cell type marker immunostaining of ferret tracheal sections for different cell clusters. Representative images of n = 3 independent ferrets.

