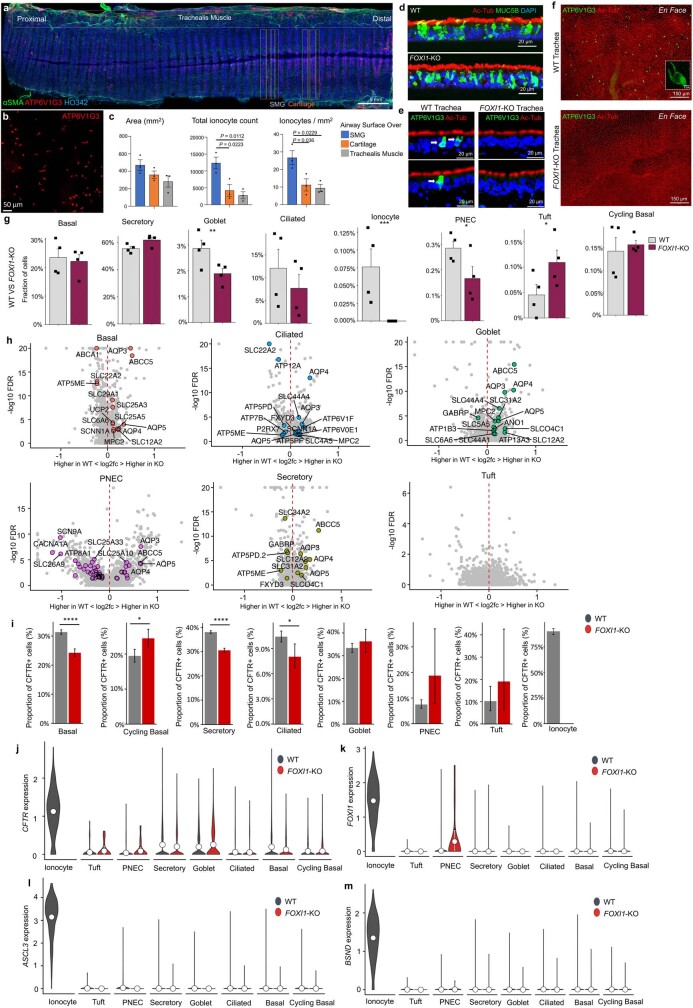
Extended Data Fig. 6. Ion and water channels are transcriptionally altered in FOXI1-KO airway epithelia.
a, Cleared WT ferret trachea was whole mount immunostained for ionocyte (ATP6V1G3) and submucosal gland (α-SMA) markers. Boxed areas show examples of regions quantified for ATP6V1G3+ ionocyte numbers in the surface airway epithelia above submucosal glands (SMG), cartilage, and trachealis muscle. b, Higher magnification of the tracheal surface showing single channel ATP6V1G3+ ionocytes. Representative images of n = 3 donors. c, Quantification of ionocyte numbers in the surface airway plane in different regions of ferret trachea from WT animals (the entire trachea was quantified, n = 3 WT donors). Bar graph showing the total area quantified, the total number of ionocytes, and the number of ionocytes per mm2. Graphs show the mean ± s.e.m. Statistical significance was determined by two-tailed Student’s t-test. d, Sections of ALI cultures of WT and FOXI1-KO airway epithelia immunostained for Ac-Tub (ciliated cells) and MUC5B (goblet cells). Representative images of n = 4 ferrets from each group. e,f, Immunostaining of (e) tracheal sections and (f) whole-mount trachea from WT and FOXI1-KO ferrets for ATP6V1G3 (ionocytes) and Ac-Tub (ciliated cells). Ionocytes (arrows) are depleted in FOXI1-KO ferrets. Representative images of n = 4 ferrets from each group. g, Cell type proportions across WT and FOXI1-KO scRNA-seq runs (Mean +/− s.e.m.; n = 4 donors each genotype, excluding FOXI1-CreERT2::ROSA-TG ionocyte enriched samples). Statistical significance was determined by Bayesian analysis: goblet cells, ** FDR < 0.01, 95% PI; ionocyte, *** FDR < 0.001, 99% PI; Tuft and PNEC, * FDR < 0.05, 90% PI. h, Volcano plots of differential channel expression within various epithelial cell types derived from WT and FOXI1-KO ALI cultures. i, The proportions of CFTR expressing basal, secretory, and ciliated cells is reduced in FOXI1-KO cultures as compared to WT culture (including FOXI1-CreERT2::ROSA-TG ionocyte enriched samples). This may be due to lower levels of ambient CFTR RNA from lysed ionocytes. Data shows the mean, n = 4 donors in KO, n = 12 donors in WT, error bars represent 95% confidence interval, **** FDR < 0.0001, * FDR < 0.05. The proportion of CFTR expressing cells per cell type were calculated by aggregating cells from all samples together (see Methods). j-m, Expression of ionocyte markers CFTR, ASCL3, FOXI1 and BSND in different cell types from WT and FOXI1-KO cultures. Data shows the mean, n = 18,664 cells from 4 FOXI1-KO donors, n = 58,435 cells from 8 WT donors. Large white point shows the mean, error bars represent 95% confidence interval. Of note, deletion of a portion of FOXI1 exon-1 led to enhanced mRNA expression from the FOXI1 locus only in PNECs, suggesting a potential functional role for FOXI1 in PNECs. The FOXI1 gene has only two exons and thus its mRNA likely has minimal non-sense mediated decay.

