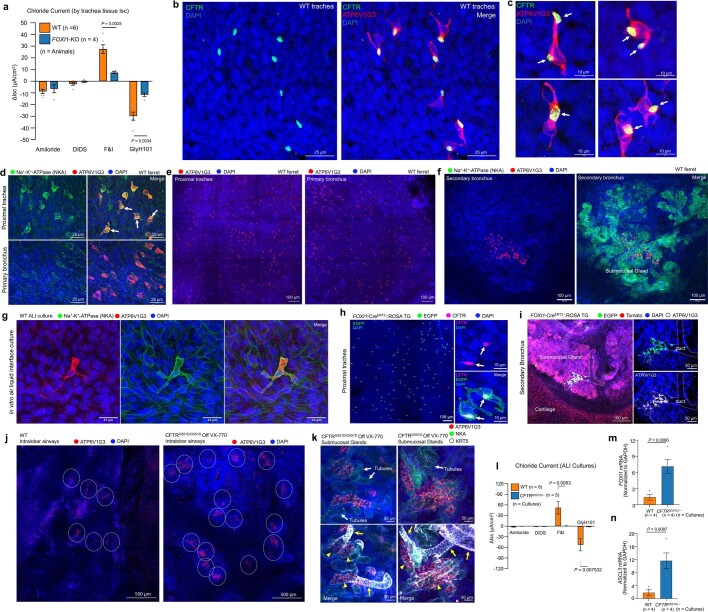
Extended Data Fig. 7. Pulmonary ionocyte function and localization pattern at different levels of the airway.
a, Change in chloride short circuit current (ΔIsc) from FOXI1-KO and WT trachea following the addition of the indicated channel antagonists and agonists (n = 6 donors for WT, 4 donors for KO, with 2-3 tracheal samples quantified from each donor and averaged). F&I, forskolin and IBMX. Graph shows the mean ± s.e.m. P value determined by two-tailed Student’s t-test. b, CFTR protein localization in ATP6V1G3+ ionocytes following whole mount staining of WT ferret trachea. Representative images from n = 4 ferrets. c, High magnification images of ATP6V1G3+ ionocytes showing CFTR protein localizes to an “apical cap” (arrows). Representative images of ionocytes with two apical caps (upper panels) or one apical cap (lower panels) are shown. Images from n = 4 ferrets. d, Na+-K+-ATPase (NKA) staining of ATP6V1G3+ ionocytes in the proximal trachea of WT ferret by whole mount staining. NKA staining in ionocytes localized to an apparent basolateral rim around the apical cap (marked by arrows). Proximal trachea showed more abundant NKA expression in ionocytes as compared to primary bronchus. Representative images from n = 4 ferrets. e, Representative whole mount images showing the frequency of ATP6V1G3+ ionocytes in the proximal trachea and primary bronchus of WT ferrets. Images from n = 4 ferrets. f, Representative whole mount images showing clusters of ATP6V1G3+ ionocytes in NKA+ submucosal glands in the secondary bronchus of WT ferrets. Images from n = 4 ferrets. g, Co-localization of ATP6V1G3 and NKA in ionocytes of WT ferret ALI cultures. Representative images from cultures derived from n = 3 donors. h, Representative whole mount image of a tamoxifen-induced adult FOXI1-CreERT2::ROSA-TG ferret trachea demonstrating CFTR staining within an apical cap (arrows) of EGFP+ ionocytes. Images from n = 3 ferrets. i, Representative image of a tamoxifen-induced adult FOXI1-CreERT2::ROSA-TG ferret secondary bronchus demonstrating traced EGFP+ATP6V1G3+ ionocytes in a submucosal gland collecting duct (marked by dotted lines). Images from n = 3 ferrets. j, Localization of ATP6V1G3+ ionocytes in whole mount stained intralobar airways from a WT and CFTRG551D/G551D (reared off VX-770) ferrets, demonstrating expansion of ionocyte clusters (circles) in the CF airway. Images from n = 4 (WT) and n = 3 (CF) ferrets. k, Localization of ATP6V1G3+ ionocytes in KRT5+-enriched gland primary ducts (yellow arrows), adjacent NKA+ collecting ducts (yellow arrowheads), and NKA+ glands tubules (white arrows) in CFTRG551D/G551D (reared off VX-770) ferrets (whole mount staining of intralobar bronchus). Images from n = 3 (CF) ferrets. l, CFTR-mediated chloride current from WT and CFTRG551D/– ALI cultures (n = 5-6 ALI cultures derived from one donor). Graph shows the mean ± s.e.m. P value determined by one-tailed Student’s t-test. m and n, RT-qPCR detection of mRNA for ionocyte-specific transcription factors (FOXI1, ASCL3) in differentiated WT and CFTRG551D/– ALI cultures demonstrating expansion of ionocytes in CF epithelium (n = 4 samples from one donor, each sample with 3 ALI cultures pooled for mRNA). Graphs show the mean ± s.e.m for the n indicated in each graph. P value determined by by two-tailed Student’s t-test.

