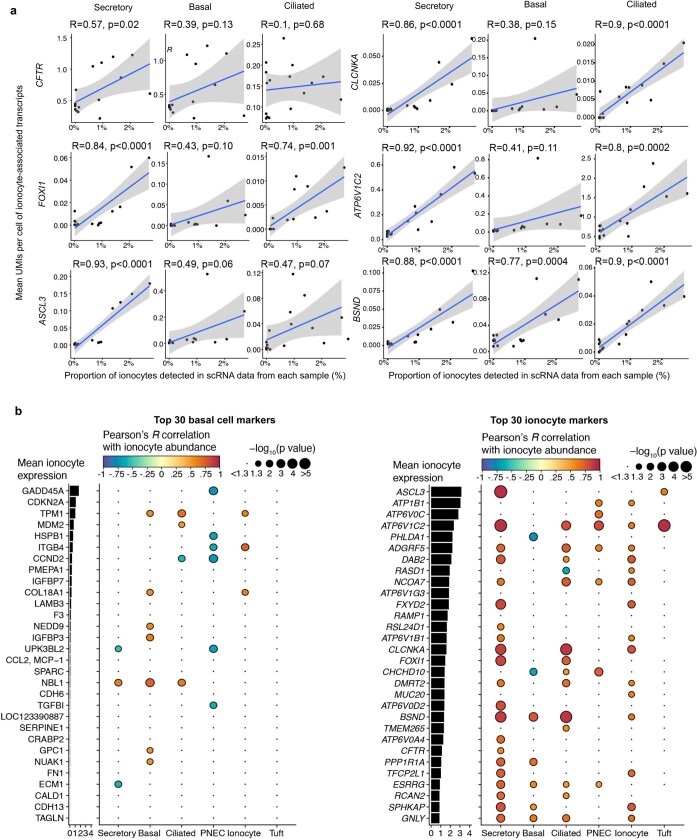
Extended Data Fig. 9. Ambient RNA from fragile ionocytes enhances apparent CFTR expression in other cell types.
a, Expression (mean UMI counts, y-axis) of ionocyte markers CFTR, FOXI1, ASCL3, CLCNKA, BSND, ATP6V1C2 (rows) in cells of each type (columns) from each ALI culture (points) correlated with the number of ionocytes detected in each culture (x-axis), particularly in secretory cells. These data include FOXI1-KO and FOXI1-CreERT2::ROSA-TG FACS-enriched sequence runs, which had the smallest and largest percentage of ionocytes, respectively. Blue line and shaded area show line of best fit and 95% confidence interval, respectively, from linear regression models fit independently for each gene. P values by Wald test. b, Dotplots show the Pearson’s R correlation (dot color, legend) and significance (dot size, legend) between proportion of ionocytes detected and expression level (as in Extended Data Fig. 6i) for the top 30 basal cell markers (rows, left) and top 30 ionocyte markers (rows, right). Genes are ordered by expression level, which is shown on left hand barplots with log2(TPM + 1) on the x-axis. In secretory cells, 21 of the top 30 ionocyte markers show a significant positive correlation, whereas only 1 of 30 basal cell markers was significant. P values: Wald test on linear regression models fit independently for each gene, no multiple hypothesis adjustment was performed since only 30 genes were tested for each panel (left, right).

