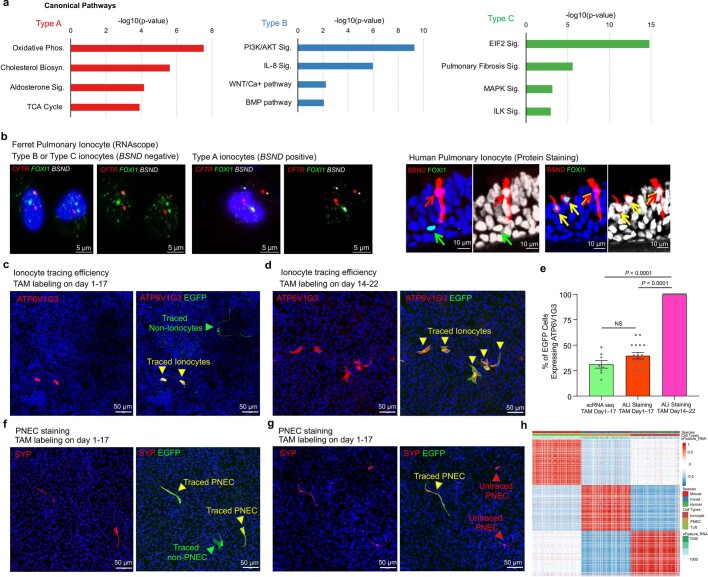
Extended Data Fig. 10. FOXI1 lineage basal cells differentiate into multiple rare cell types in vitro.
a, Ingenuity Pathway Analysis (IPA) of differential gene expression data from ionocyte subtypes. The charts represent the top significantly associated canonical pathways. P value was calculated using a right-tailed fisher’s exact test. b, (Left) RNAscope validation of Type A, Type B or Type C ionocytes from a cytospun ferret ALI culture. Representative images of n = 10 ionocytes. (Right) Immunofluorescence validation of Type A, Type B or Type C ionocytes in a section of human ALI culture. BSND positive ionocytes are Type A subtype, some of which co-express FOXI1 (yellow arrows) or lack FOXI1 expression (red arrows). BSND negative ionocytes that express FOXI1 (green arrows) are Type B or Type C subtype. Intermediated expression of FOXI1 in BSND positive cells is marked by overlapping yellow and red arrows. Right panels show nuclei in white to demarcate the cell more clearly. Representative images of n = 7 ALI cultures. c,d, Lineage tracing of FOXI1-CreERT2::ROSA-TG ALI culture following hydroxytamoxifen (TAM) treatment on (c) day 1–17 or (d) day 14–22 produce different proportions of EGFP+ATP6V1G3+ ionocytes and EGFP+ATP6V1G3– other rare cell types. Yellow and green arrowheads indicate traced ionocytes or traced non-ionocytes, respectively. Representative image from n = 16 independent samples from TAM day 1–17 group and n = 15 independent samples from TAM day 14–22 group. e, Percentage of FOXI1-CreERT2 traced EGFP+ cells that also expressed ATP6V1G3 from scRNA-seq and the two TAM treatment protocols (Mean ± s.e.m.; n = 8 independent samples in scRNA-seq group, n = 16 independent samples from 4 different animals in ALI TAM Day 1–17 group, n = 15 independent samples from 4 different animals in ALI TAM Day 14–22 group; P value determined by one-way ANOVA and Tukey’s multiple comparisons test). f,g, Lineage tracing of PNECs in actively differentiating FOXI1-CreERT2::ROSA-TG basal cells treated with TAM on day 1–17 of ALI culture. Cultures were immunostained with PNEC marker SYP on day 21. Yellow, red, and green arrowheads indicate traced PNEC, untraced PNEC, or traced non-PNEC, respectively. Representative image of 11 independent cultures. h, Cell-cell Pearson correlation coefficient matrix (r, color bar) across species (human, mouse, ferret) ordered by cluster assignment (tuft, PNEC, ionocyte).

