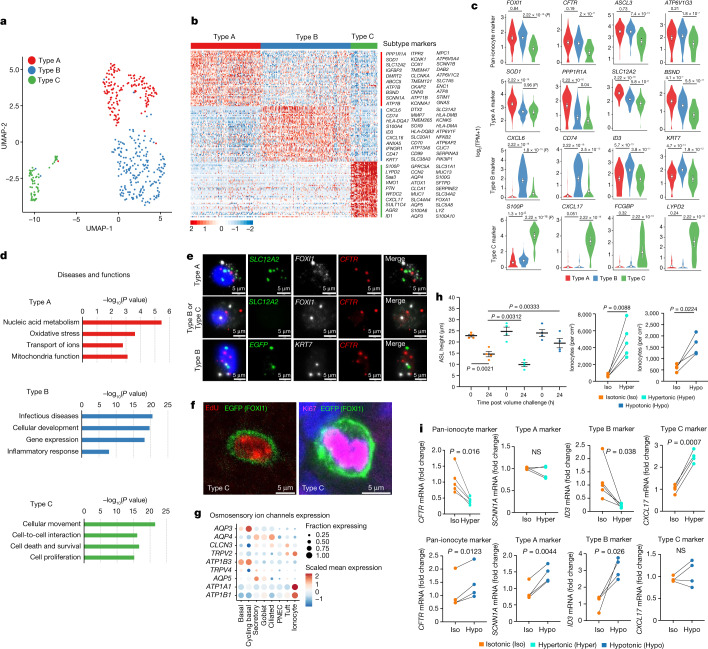
Fig. 4. Distinct subtypes of pulmonary ionocytes exist and respond to osmotic stress.
a, UMAP of 449 ionocytes coloured by subcluster. b, Type A, B and C ionocyte gene expression signatures showing relative expression (Z-score of log2(TPM + 1)). c, Distribution of expression levels (log2(TPM + 1)) for ionocyte subtype markers (white circle, mean; error bars, 95% confidence interval; n = 449 ionocytes from 8 donors; P value, Wilcoxon). d, Ingenuity pathway analysis of differentially expressed ionocyte subtype genes showing top significantly associated diseases and functional pathways (right-tailed Fisher’s exact test). e, RNAscope validation of ionocyte subtypes using cytospun samples from ALI cultures. Representative image of n = 36 ionocytes. f, Differentiated FOXI1-CreERT2::ROSA-TG ALI cultures induced with OH-Tam and later pulsed-labelled with EdU. Cultures were then stained for Ki67 or EdU. Representative image of n = 20 ionocytes. g, Osmosensory ion and water channel gene expression in different cell types. h, Hyperosmotic and hypoosmotic conditions induce opposing forces on ASL hydration. Left, differentiated ALI cultures were exposed to hyperosmotic (+77 mOsm) and hypoosmotic (−77 mOsm) basolateral media for 24 h and ASL height was measured at 0 and 24 h following small volume addition to the apical surface. Data are mean ± s.e.m. Statistical significance by paired two-tailed Student’s t-test (n = 4 donors, each using 2 cultures). Right, quantification of ionocyte numbers in 21 days ALI cultures maintained under hyperosmotic and hypoosmotic conditions throughout basal cell differentiation. Data are mean ± s.e.m. Statistical significance by paired two-tailed Student’s t-test (hyperosmotic: n = 5 donors, 1 culture per donor, quantified as FOXI1-CreERT2 EGFP+ cells; hypoosmotic: n = 4 donors, each using 2–3 cultures, quantified as ATP6V1G3+ cells). i, Changes in subtype marker gene expression by RT–qPCR in ALI cultures maintained under hypoosmotic or hyperosmotic stress as in h. mRNA fold change was calculated by the ΔΔCt method. Statistical significance was determined by paired two-tailed Student’s t-test (n = 4 donors, each using 3 cultures). TPM, transcripts per million.

