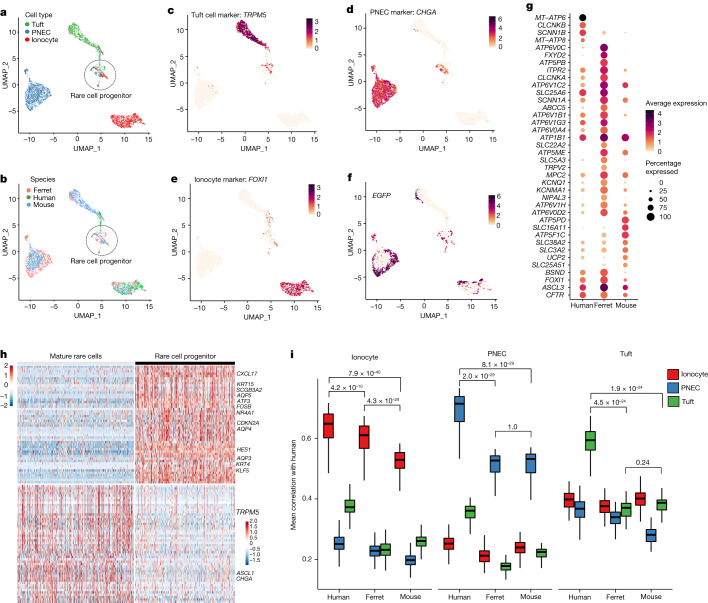
Fig. 5. Rare cell-type comparisons from the proximal airway epithelium of human, ferret and mouse.
a, UMAP of rare cell type transcriptomes across human, ferret and mouse, coloured by rare cell type (tuft, neuroendocrine/PNEC, ionocyte). b, UMAP of rare cell types across human, ferret and mouse, coloured by species. c, Expression of rare cell-type markers across rare cell clusters. UMAP plot shows cells coloured by expression (log2(TPM + 1), colour bar) of tuft marker TPRM5. d, UMAP plot shows cells coloured by expression of PNEC marker CHGA. e, UMAP plot shows cells coloured by expression of ionocyte marker FOXI1. f, UMAP plot of EGFP expression marks FOXI1-CreERT2::ROSA-TG lineage-labelled cells from ferret ALI scRNA-seq experiments including the common rare cell progenitor. g, Ion channel gene expression levels and fraction of ionocytes that express each gene across human, ferret and mouse (MT-ATP6, MT-ATP8, ATP5PD and CLCNKB are not annotated in ferret genome and thus show no expression). h, Gene expression signatures of rare cell progenitors compared with mature rare cells. i, Interspecies comparison of mouse and ferret rare cell-type transcriptional signatures with those of human. Ferret ionocytes are transcriptionally more similar to human ionocytes. Boxplots are standard: lower and upper hinges correspond to the first and third quartiles (the 25th and 75th percentiles), and the upper and lower whiskers extend from the hinge to the largest or smallest values, respectively, no further than 1.5 × IQR from the hinge where IQR is the interquartile range or distance between the first and third quartiles. Centre shows the mean. Statistical significance was determined by Wilcoxon test for the marked comparisons. n = 1,655 cells from 12 ferret donors, n = 1,640 cells from 9 mice donors, n = 885 cells from 60 human donors.

