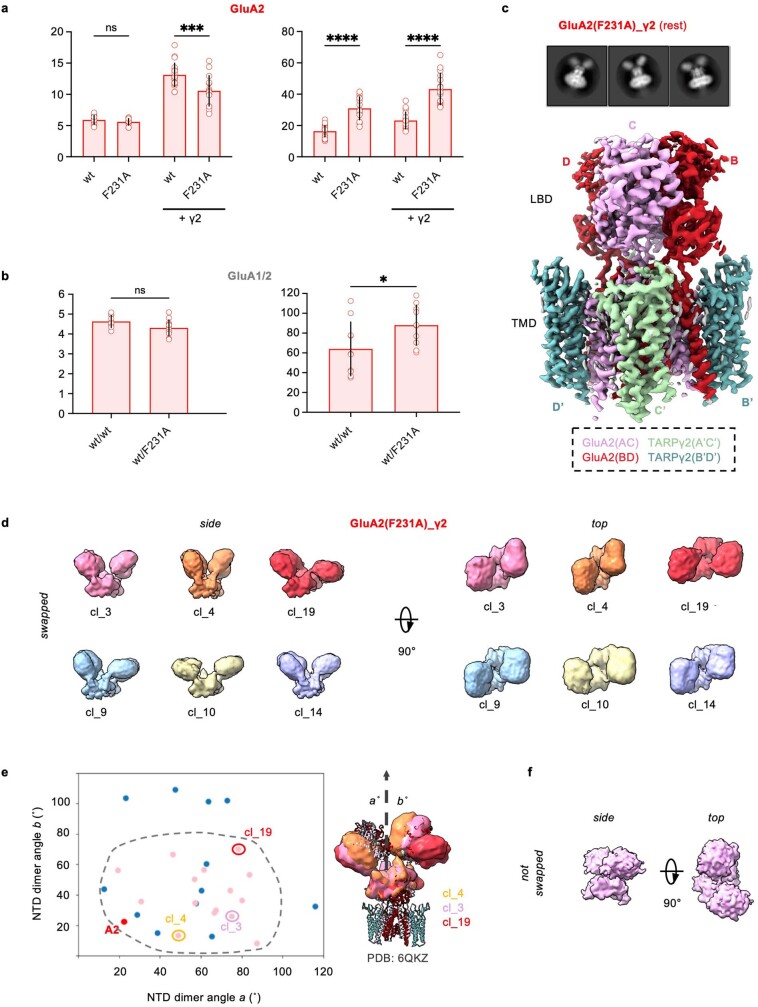
Extended Data Fig. 8. Disrupting the NTD inter-dimer interface.
a, Summary graph for time constants of desensitization and recovery from desensitization in outside-out recordings of GluA2 (edited-Gly) with and without TARP γ2. Data are presented as mean ± SD. One-way ANOVA (F3,54 = 68.40; p < 0.0001)des; (F3,65 = 52.99; p < 0.0001)rec with Sidak’s multiple comparison test (τdes: TARP-free: p = 0.8849; + γ2: ***p = 0.0001; τrec: TARP-free: ****p < 0.0001; + γ2: ****p < 0.0001). Number of patches - τdes: 11 (wt), 12 (F231A), 20 (wt+ γ2), 15 (F231A + γ2); τrec: 22 (wt), 13 (F231A), 18 (wt+ γ2), 16 (F231A + γ2). b, As A, for GluA1/GluA2 (unedited-Arg) heteromers (TARP-free). Data are presented as mean ± SD. Unpaired two-tailed Student’s t-test: t(20) = 2.055; p = 0.0531 (τdes), t(18) = 2.234; *p = 0.0384 (τrec). Number of patches - τdes: 10 (wt/wt), 12 (wt/F231A); τrec: 10 (wt/wt), 10 (wt/F231A). c, The resting state GluA2(F231A)/γ2 LBD-TMD map is shown together with representative 2D class averages, demonstrating the high resolution in the receptor core and the lack of NTD inter-dimer interface. d, Side (left) and top (right) views of representative NTD 3D classes from resting state GluA2(F231A)/γ2 show separation and splaying of the NTD dimers, but less splaying than GluA1/γ3. e, Conformational landscape of resting state GluA2(F231A)/γ2 (pink) and GluA1/γ3 (blue) in the space of splaying angles, with an A2-containing reference structure (PDB: 6QKZ; ‘A2’ red) shown for comparison, shows reduced splaying of GluA2(F231A)/γ2. Representative classes in d are circled with corresponding colors and shown overlaid on the reference structure (right). f, A GluA2(F231A)/γ2 3D NTD class from a non-swapped receptor.

