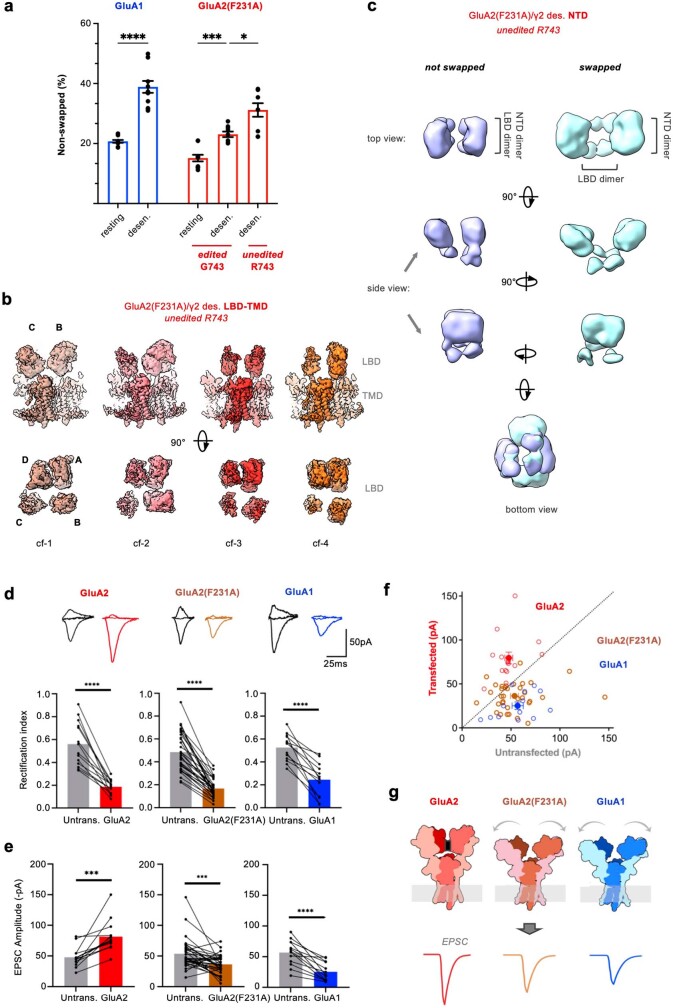
Extended Data Fig. 10. Further variability within GluA1/γ3 and GluA2(F231A)/γ2 desensitized states and its impact on synaptic physiology.
a, Quantification of the percentage of non-swapped dimers across different datasets is shown based on a consensus classification approach (see Methods). Black points are from individual classifications, bars represent mean values and error bars represent standard error of the mean for resting GluA1/γ3 (20.3 ± 0.5%, n = 12), desensitized GluA1/γ3 (38.9 ± 2.0%, n = 12), resting R/G-edited GluA2(F231A)/γ2 (Gly743; 15.2 ± 1.1%, n = 10), desensitized R/G-edited GluA2(F231A)/γ2 (Gly743; 23.1 ± 0.9%, n = 9), and desensitized R/G-unedited GluA2(F231A)/γ2 (Arg743; 31.2 ± 2.3%, n = 9). Welch’s one-way ANOVA (W4,20.73 = 30.46; p < 0.0001) with Dunnet’s T3 multiple comparison test (****p < 0.0001, ***p = 0.0001, *p = 0.0191). b, Four main conformations (cf1-4) of desensitized R/G-unedited GluA2(F231A)/γ2 (R743) (top: side views; bottom: top view onto LBD tier). Compared to the edited (Gly743) GluA2 F231A isoform, greater splitting of the D/A dimers are evident together with larger motions of the C/B subunits, which is pronounced in cf-2 and cf-3. c, Two representative NTD classes from the unedited (R743) GluA2(F231A)/γ2 desensitized state with the clearest LBD arrangement, showing non-swapped and swapped arrangements. d, Synaptic expression of transfected AMPARs in organotypic slice shown by a reduction in Rectification Index relative to a neighboring untransfected neuron recorded simultaneously: GluA2Q (paired two-tailed t-test: t = 8.14, n = 15, p < 0.0001), GluA2Q(F231A) (t = 12.6, n = 34, p < 0.0001) or GluA1 (t = 7.13, n = 13, p < 0.0001). Representative traces of EPSCs at −60, 0 and +40 mV holding potential shown above corresponding bar graphs. e,f, EPSC peak amplitude increases in GluA2Q expressing neurons (untransfected: 48 ± 15 pA, GluA2: 79 ± 26 pA; paired two-tailed t-test t = 4.82, n = 15, p = 0.0003), and decreases in GluA2Q F231A (untransfected: 53 ± 24 pA, GluA2(F231A): 36 ± 15 pA; t = 3.75, n = 34, p = 0.0007) and GluA1 (untransfected: 57 ± 21 pA, GluA1: 25 ± 15 pA; t = 5.72, n = 13, p < 0.0001) expressing neurons relative to their neighboring untransfected cell. g, Proposed model of how the enhanced mobility of the NTD in GluA2(F231A) and GluA1 may impact synaptic receptor anchoring, and thereby reduce the EPSC observed upon presynaptic release. Black rectangle in wildtype GluA2 marks the tetrameric interface, absent or disrupted in the other two receptors.

