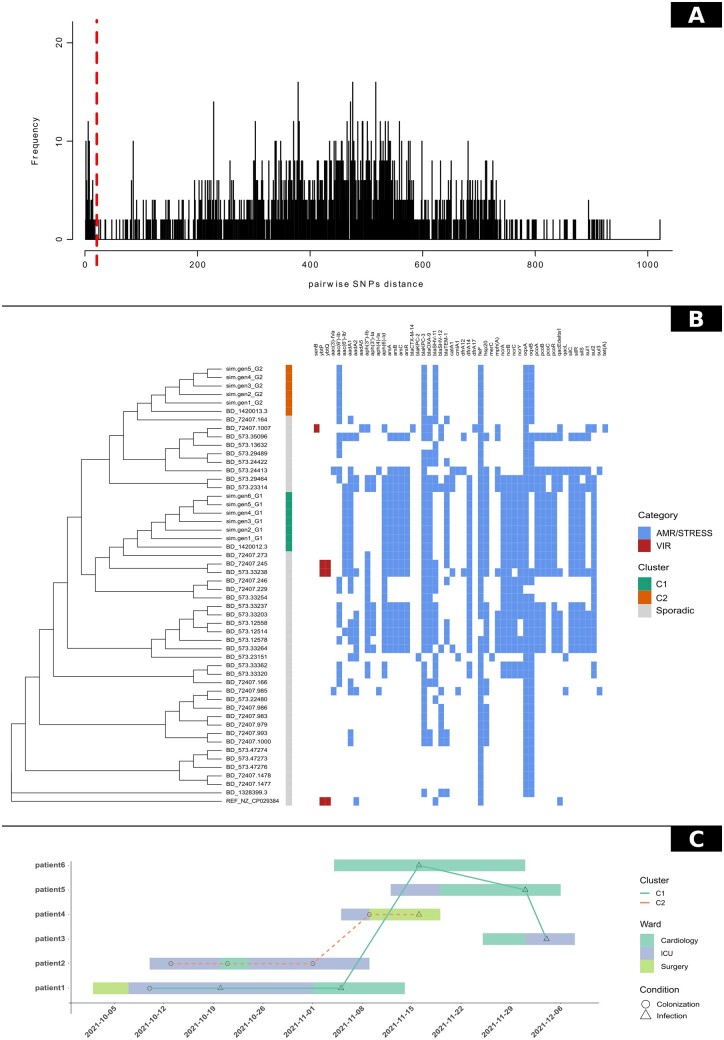
Figure 1.
The P-DOR outputs of the test analysis. (A) Phylogenetic tree of the Analysis Dataset (AD). The first column shows epidemiological clusters of strains with SNP distances below the threshold set by the user. In addition, a heatmap representing the detection of resistance and virulence determinants is shown next to the tree for a better representation of the epidemic event. (B) Distribution of SNP distances calculated between all permutations of genome pairs in the AD. (C) Timeline depicting the movements of the patients during the hospitalization. Points indicate outbreak genomes and are shaped according to the isolation source of the corresponding strain. Samples are linked if their genetic distance in terms of SNPs is below the threshold.

