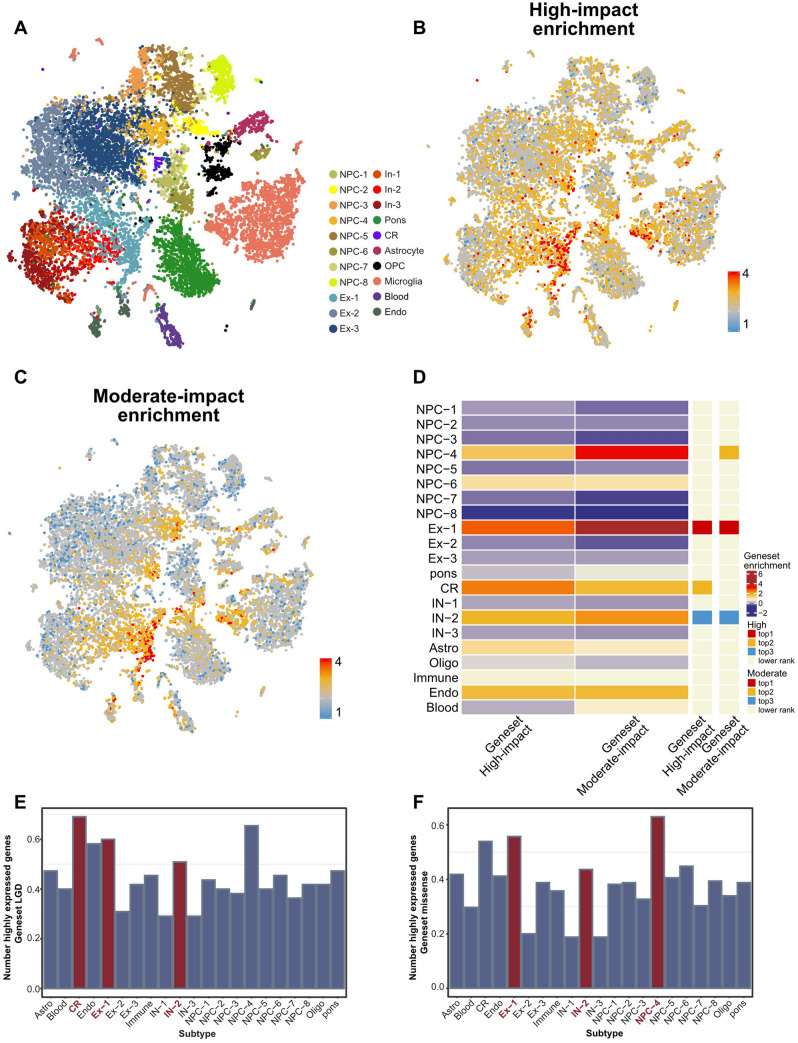
Fig. 3.
Expression pattern of ASD risk genes among different cell types. A Clustering of single-cell RNA-seq data from different brain regions. Cell types are colored differently. B Visualization of enrichment scores of the 55 High-impact genes by UMAP. C Visualization of enrichment scores of the 165 Moderate-impact genes by UMAP. D Heatmap showing averaged enrichment scores of ASD risk genes among the different subtypes (high, red; low, blue). The top three most enriched cell types for each gene set are shown on the sidebar. E Histogram showing the proportion of highly expressed genes (genes expressed in at least 25% of cells in an individual cell type) of the 55 High-impact genes among cell types. F Histogram showing the proportion of highly expressed genes (genes expressed in at least 25% of cells in an individual cell type) of the 165 Moderate-impact genes among cell types.

