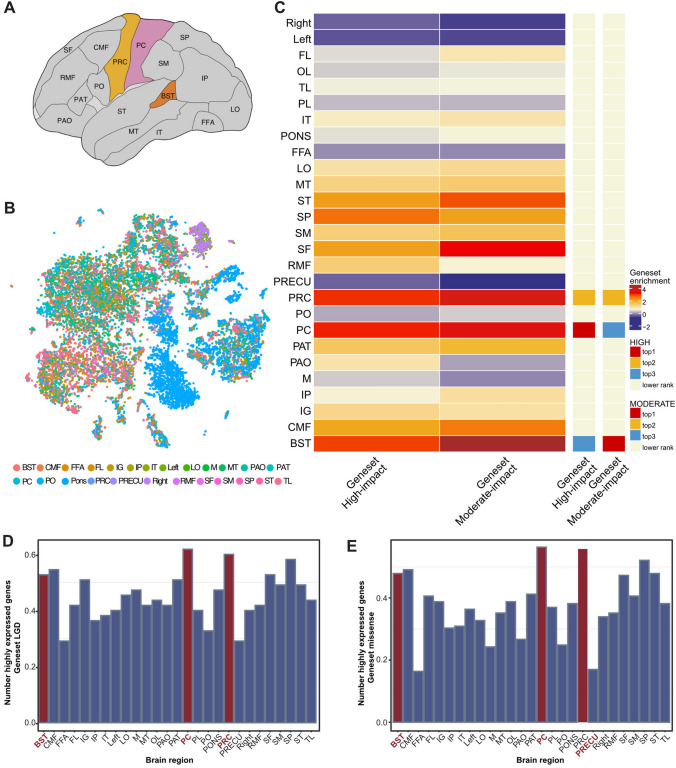
Fig. 4.
Expression pattern of ASD risk genes among different brain regions. A Schematic showing the 22 brain sub-regions used in published human single-cell RNA-seq data and applied in the analysis of this work. B UMAP display of diverse brain regions (abbreviations are listed in Table S7). Brain sub-regions are differently colored. C Heatmap showing averaged enrichment scores of ASD risk genes among different brain regions (high, red; low, blue). The top three most enriched brain regions for each gene set are shown on the sidebar. D–E Histograms displaying the proportions of highly expressed genes (genes expressed in at least 25% of cells from individual brain regions) of the 55 High-impact genes (D) and the 165 Moderate-impact genes (E) among various brain sub-regions.

