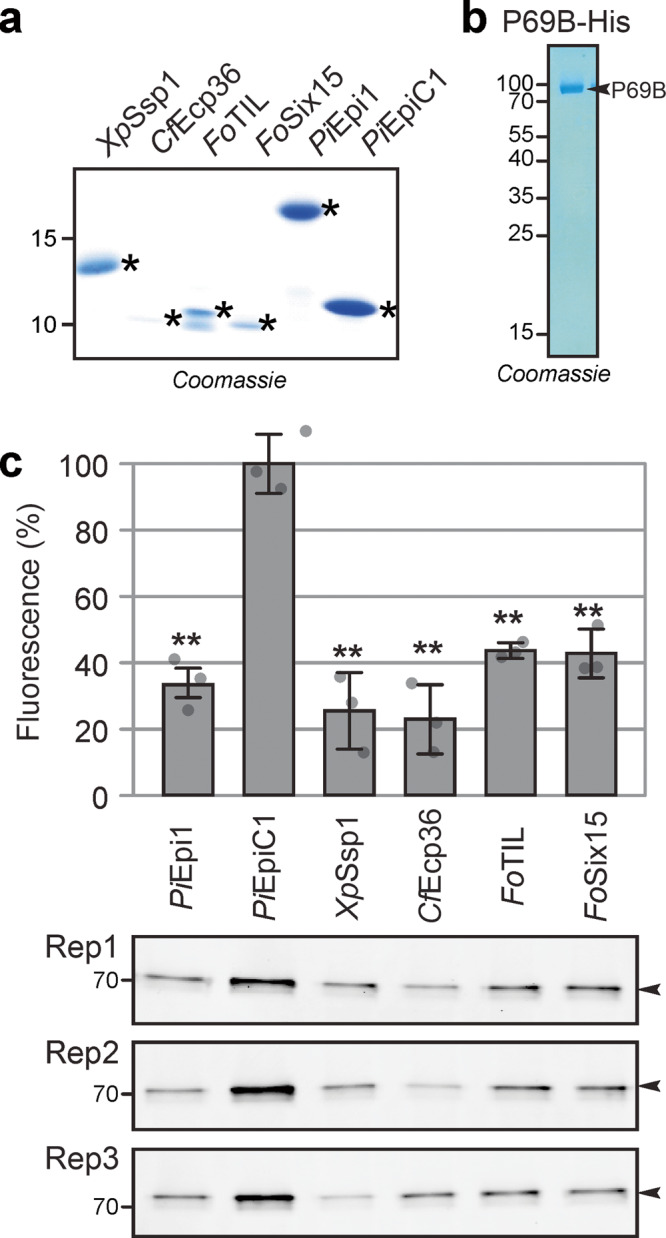
Fig. 4. Activity labeling of P69B is suppressed by four inhibitors.

a Purified candidate inhibitors. Candidate inhibitors and Epi1a (positive control) and EpiC1 (negative control) were expressed in E. coli as fusion proteins with N-terminal His-MBP-TEV. The fusion proteins were purified over Ni-NTA and amylose resin, subsequently, and then cleaved by TEV protease. See Supplementary Fig. 2 for the full gel. His-TEV protease and purification tags were subsequently removed using Ni-NTA and MW cut off filter and SSPs were used for inhibition assays in (c). Purification of candidate inhibitors was repeated at least once for each candidate independently. b P69B-His was transiently expressed in Nicotiana benthamiana by agroinfiltration and purified over Ni-NTA from apoplastic fluids isolated at 5 days-post-agroinfiltration. The eluate was analysed on protein gel stained with Coomassie (shown here) and used for inhibition assays (in (c)). Purification of P69B-His was repeated twice, not including experiments for a previous publication57. c All four candidate inhibitors and the Epi1 but not EpiC1 suppress activity-based labeling of P69B with FP-TAMRA. Purified P69B-His was pre-incubated with purified (candidate) inhibitors at a 1:100 molar ratio and then labeled with FP-TAMRA in n = 3 replicates using the same purified proteins. Proteins were separated on protein gels and scanned for fluorescence. Fluorescence was quantified and the signal intensity of the negative control (EpiC1) was set at 100% labeling to calculate the relative labeling upon preincubation with the positive control (Epi1) and the four candidate inhibitors. Error bars represent STDEV of n = 3 replicates. **p < 0.01 (p-values from two-sided, pairwise t-tests were adjusted for multiple testing using the Benjamini–Hochberg procedure). These p-values are 0.00065; 0.00091; 0.00063; 0.00046; and 0.0010 for comparing EpiC1 with PiEpi1; XpSSP1; CfEcp36; FoTIL and FoSix15, respectively. MW makers are listed in kDa. A similar suppression of labeling was observed at 2-fold higher candidate inhibitor concentrations and in a repeat experiment using independently purified proteins. Original images for the gels are provided in Supplementary Data 9 and the raw quantification data in Supplementary Data 6.
