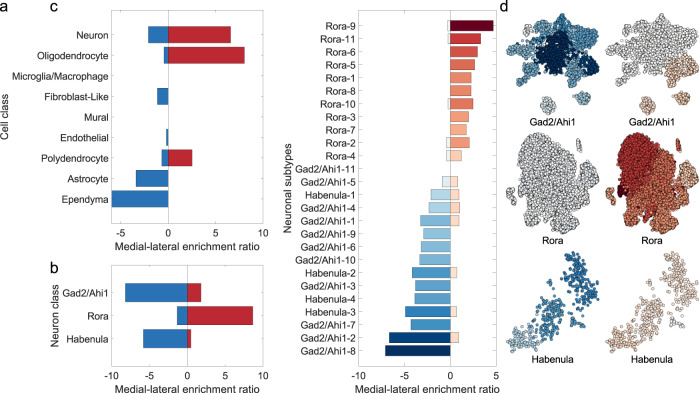
Fig. 4. PC1 reflects graded distinctions in cytoarchitecture.
a Enrichment ratio for medial- and lateral-genes expressed by cell class. The medial-lateral enrichment ratio is positive when that cell class is enriched for lateral-genes and negative when enriched for medial-genes. b Enrichment ratio for medial- and lateral-genes expressed by each neuron class33. c Enrichment ratio for medial- and lateral-genes expressed by each neuronal subcluster. Subclusters were defined by clustering cells within each neuron class by their pattern of gene expression. In the bar plot, neuronal subclusters are ordered by their summed medial-lateral enrichment ratio. d Enrichment ratios projected onto t-SNE plots for the different neuron type subclusters. Cells belonging to each subcluster are coloured according to their enrichment value as indicated in (c) for medial- (left) and lateral-genes (right). Source data are provided as a Source Data file.

