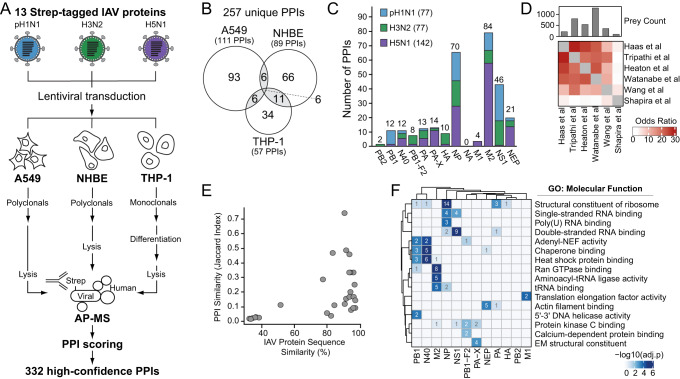
Fig. 1. AP-MS identifies 332 pH1N1, H3N2 and H5N1 IAV-human PPIs.
A AP-MS experiment design. 13 2X-Strep-tagged proteins from pH1N1, H3N2 and H5N1 IAV were individually transduced by lentivirus to generate stable A549, NHBE and THP-1 cell lines. A549 and NHBE cells were cultured as polyclonal pools. THP-1 cells were cultured as monoclonal isolates and subsequently treated with Phorbol-12-myristate-13-acetate (PMA) to induce differentiation into a macrophage-like state. All cells were treated with doxycycline to induce IAV protein expression for 24 hours and subsequently lysed. Affinity-purified IAV proteins and co-purified human proteins were identified by MS and scored to assign interaction confidence. B Venn diagram of unique IAV-human PPIs identified in each cell type. The total 332 high-confidence PPIs were unified across virus strains, resulting in 257 unique PPIs by cell type and 29 PPIs that are shared in at least two of the three cell types (grey shading). C Bar graph of the unique IAV-human PPIs identified for each IAV protein and strain. PPI numbers reported are unified across cell types. D Identification correlation matrix comparing the human interacting proteins identified by AP-MS in this study with other published studies that used AP-MS with affinity-tagged IAV proteins exogenously expressed in cell lines28,30, AP-MS in the context of virus infection24,29, and an orthologous yeast two-hybrid approach34. E Comparison of shared protein interactions (PPI similarity) by Jaccard index against IAV protein sequence similarity. PPIs reported are unified across cell types. F Heatmap of gene ontology (GO) molecular function enrichments among the human interacting proteins of indicated IAV proteins, unified across all strains and cell types and clustered by correlation of enrichment profiles. GO terms were curated from the top 3 non-redundant terms with at least 2 genes for at least one IAV protein. Increasing shading intensity reflects increasing significance of the enrichment term. Number of proteins per enriched cluster are shown in white if significant (adjusted p-value < 0.002; one-sided Fisher’s exact test), and grey if not significant (adjusted p-value > 0.002; one-sided Fisher’s exact test).

