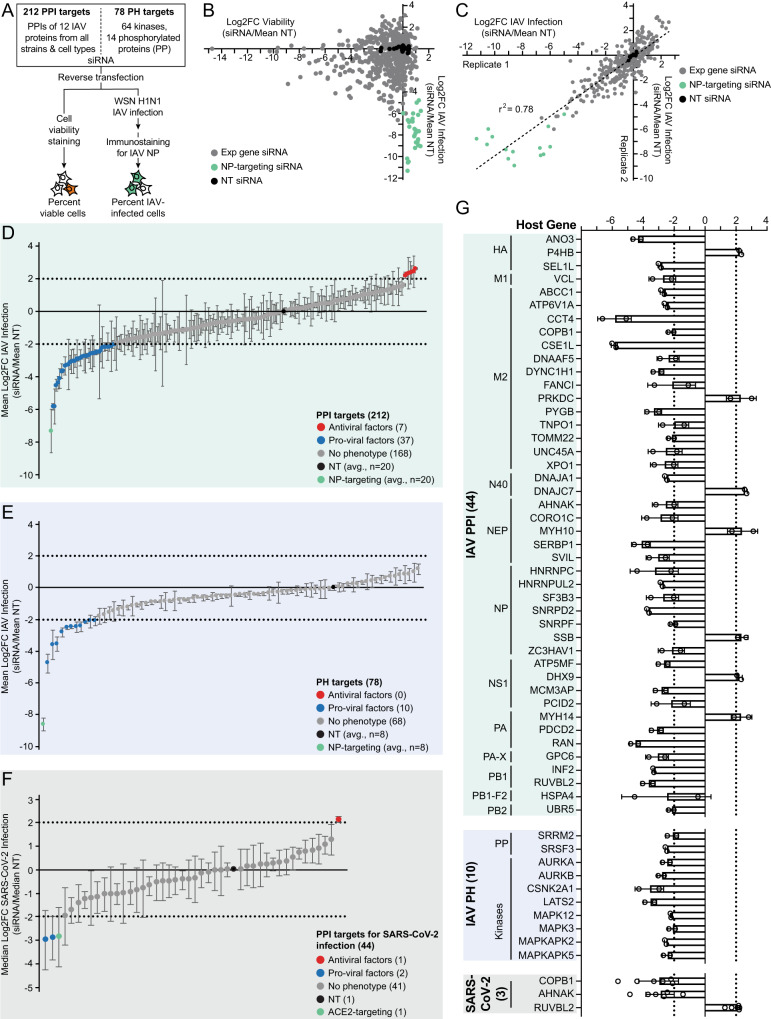
Fig. 5. siRNA knockdown identifies 54 pro-viral and antiviral factors of IAV and SARS-CoV-2 infection.
A Arrayed siRNA screen approach in A549 cells reverse-transfected in n = 2 biologically independent samples with gene-targeting, non-targeting (NT) or IAV NP-targeting siRNA, and infected with Influenza A/WSN/1933 H1N1 (MOI 0.1, 24 hours). Cell viability (live-cell staining) and percent IAV infection (%NP-positive (%NP + ) cells; immunostaining for IAV NP) were quantified by flow cytometry. Correlation plots comparing: B the cell viability against IAV infection for each siRNA from each biological duplicate; or C the variation in IAV infection between the biological duplicates. Log2FC was calculated by normalizing %viable or %NP+ cells for each siRNA against the mean of multiple replicate-matched NT siRNA (siRNA/mean NT) (green dots=IAV NP-targeting siRNA, black dots=NT siRNA, grey dots=experimental gene-targeting siRNA). Distribution of log2FC in IAV infection for (D) 212 PPI targets and (E) 78 PH targets, plotted as the mean of n = 2 biologically independent samples per target. The log2FC in IAV infection was calculated for each siRNA against the mean replicate-matched NT siRNA (blue dots=pro-viral factors (mean log2FC < -2), red dots=antiviral factors (mean log2FC > 2), grey dots=no/weak phenotype; green dot=IAV NP-targeting siRNA; black dot=NT siRNA; error bars represent standard deviation). F Distribution of log2FC in SARS-CoV-2 infection for 44 IAV PPI targets plotted as the median of six replicates (n = 2 biologically independent samples, each in n = 3 technical replicates) per target. The log2FC in SARS-CoV-2 infection was calculated for each siRNA against a replicate-matched NT siRNA (blue dots=pro-viral factors (median log2FC < -2), red dots=antiviral factors (median log2FC > 2), grey dots=no/weak phenotype; green dot=ACE2-targeting siRNA; black dot=NT siRNA; error bars represent median absolute deviations (MAD)). G Bar chart of pro-viral and antiviral factors for IAV and SARS-CoV-2 screens plotted as the mean log2FC in IAV infection (data re-plotted from D and E; error bars represent standard deviation) and the median log2FC in SARS-CoV-2 infection (data re-plotted from F; error bars represent MAD).

